
Learn how to turn plain data into professional dashboards
If you work with data at your job, learning to analyze data and build dashboards will give you a career skill that will make you highly valuable in the professional world.
Google Sheets provides an amazing free platform where dashboards can be built quickly, without having to have a degree, certification, or programming skills.
Want to have a custom spreadsheet built for your business? Click the button below to learn how I can bring your project to life and save your business time.
In this course, you will learn how to transform plain spreadsheet data into beautiful Google Sheets dashboards.
Build professional dashboards
Simplify and analyze important data
Visualize the performance of your business
After completing this course, you will:
- Be able to create custom dashboards with your own data
- Be able to analyze and organize data quickly and easily
- Be able to create interactive dashboards with custom settings
- Have confidence working with spreadsheets in the professional world
- Have skills that will allow you to be paid for spreadsheet work
- Have an advantage when applying for professional jobs
What is a Dashboard?
A dashboard is a visual display that shows you important information related to the performance of a company, such as the performance of employees, products, services, students, etc.
Dashboards transform plain data that is hard to read, into a professional report that others can easily understand.
A dashboard allows you to view performance indicators that provide vital information about your company, which allows you to make smart, data-driven decisions.
Why use Google Sheets to build dashboards?
Google Sheets is the ultimate platform for building dashboards because it is free, easy to learn, and has the features / functionality needed to build beautiful dashboards.
Companies all around the world both big and small, are using Google Sheets to analyze their data and turn it into dashboards. Many companies are already running on Google apps and using Google Sheets regularly, but more and more people are discovering the amazing potential of using Google Sheets to manage and visualize data.
By learning how to build dashboards in Google Sheets you can easily and quickly learn a skill that is highly valued in the professional world.
Who teaches the course?

My name is Corey Bustos, and I have been building Google Sheets dashboards professionally for online schools and other businesses, for over 10 years.
Before I learned to use Google Sheets, I had an electronics degree that had gotten me nowhere, and a job as an academic coach for high-risk kids.
Then I started learning how to use Google Sheets for fun, and soon realized that I could use my skills to analyze student data and turn it into dashboards. Before long I was creating dashboards for an entire school location, and then an entire region, and eventually I got a call that offered me a full-time position in data integration for a statewide education management organization.
I was amazed at how much my Google Sheets skills had done for me, where my expensive degree had done basically nothing for me except leave me in debt.
Now, I have doubled my salary and secured a full-time remote position, all because of Google Sheets. Perhaps the best reward, has been having a skill that makes me feel valued in the professional world. Even before my job changed, as an academic coach, Google Sheets allowed me to take control of my job and to be a more valued team member.
I am excited to teach you the data skills that will help you succeed in your current position, and that may even help you advance your career.
What you get with the course
Step-by-step video lessons
Copies of the completed dashboards
Copies of the raw data files
Bonus: Formulas cheat sheet
(Get the exact list of formulas that I use to build any dashboard)
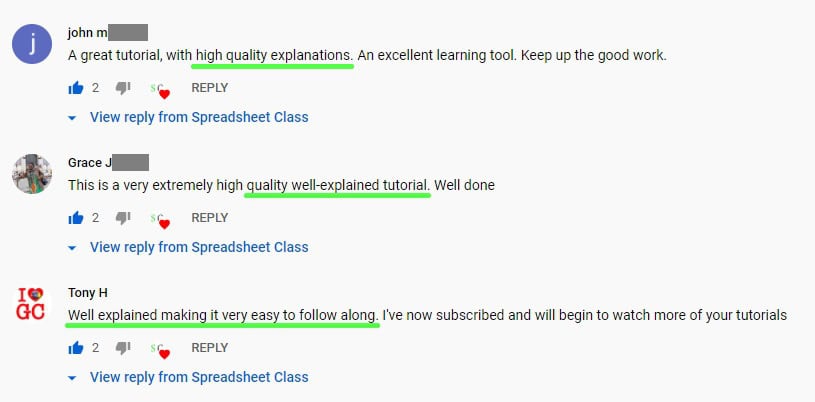
Course Testimonials
See what others said about this course, below!
Who this course is for
- Anyone who works with spreadsheet data at their job
- Anyone who has a need for analyzing data or building dashboards
- Business owners who want to manage their own data
- People seeking a new, highly valuable career skill
- Beginner Google Sheets users who want to become highly skilled / highly capable in Google Sheets
The dashboards that you will create
Below are the three dashboards that we will create together during the course. With each dashboard, you will learn new methods and formulas that you can apply to your own dashboard building projects.
1. Customer Survey Dashboard
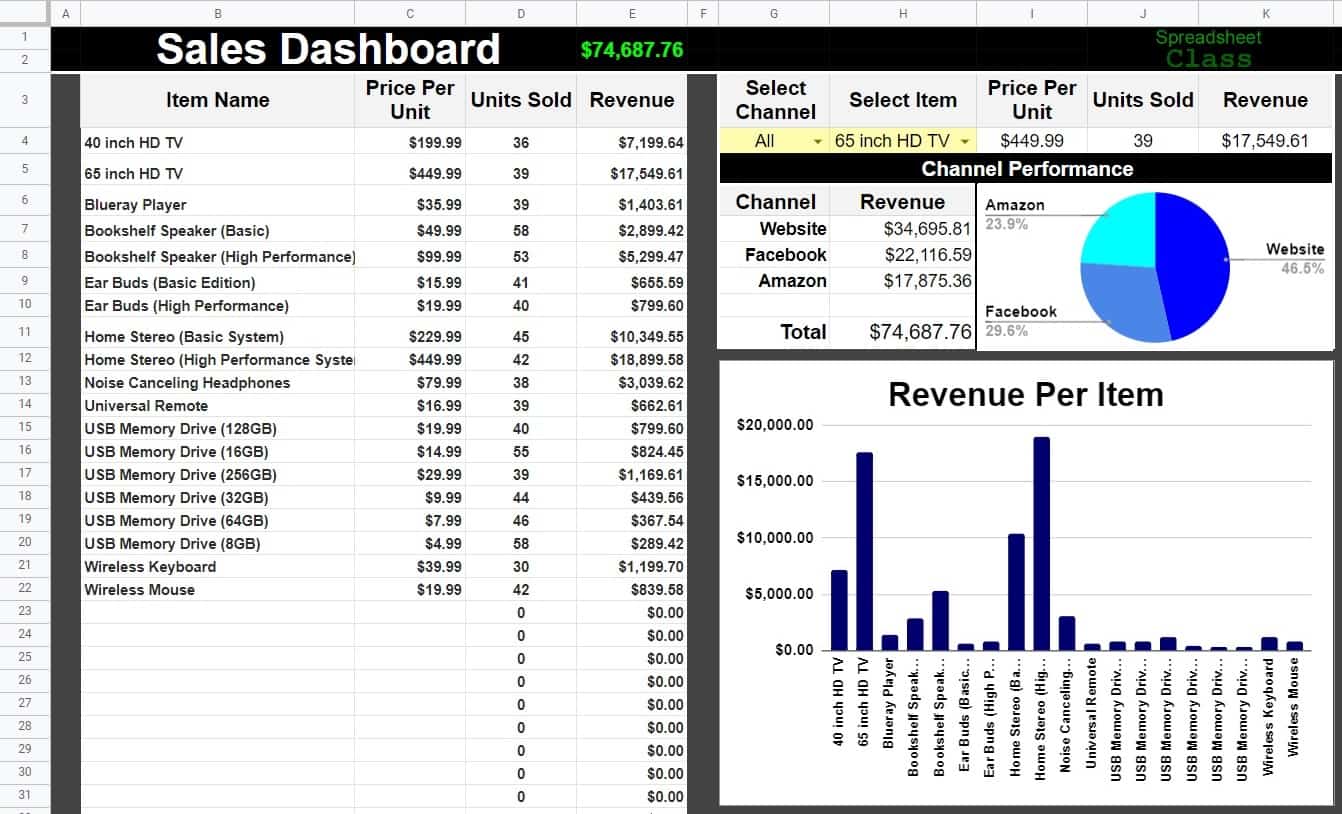
2. Sales Dashboard
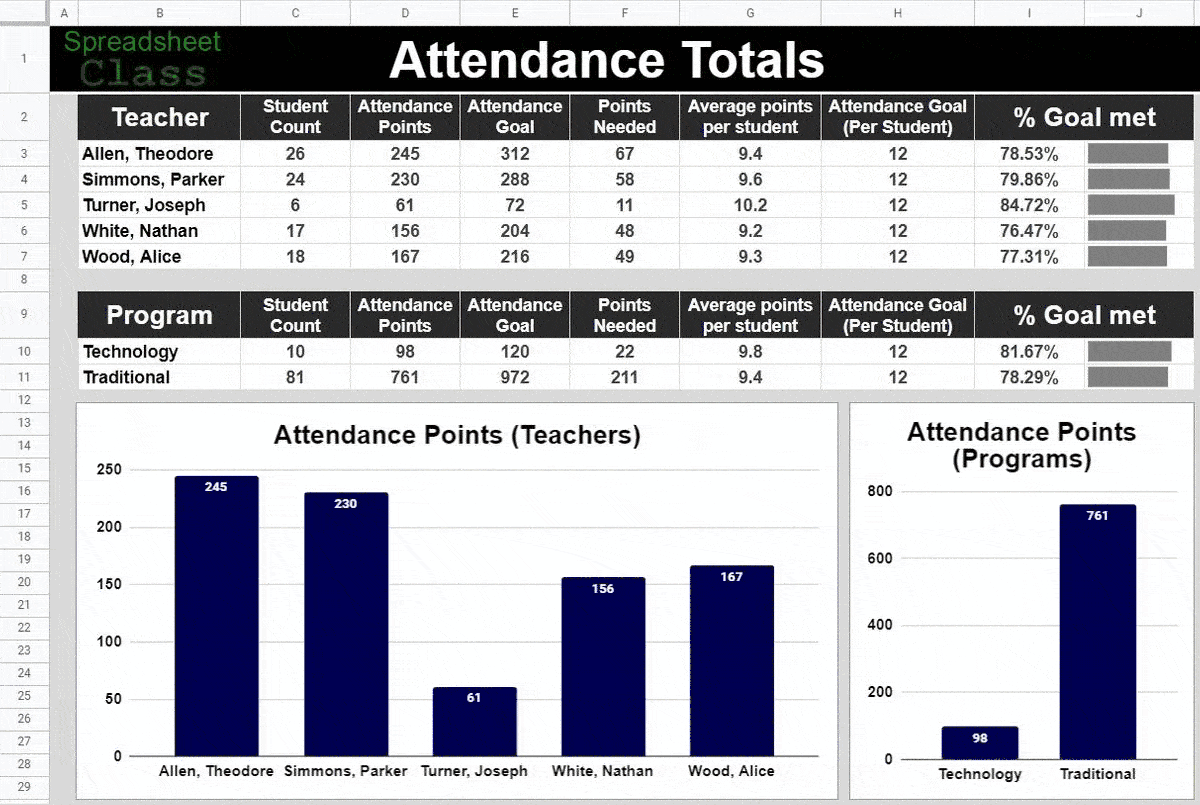
3. Attendance Dashboard (Simple + Advanced)
You will get a copy of each of the completed dashboards so that you can refer to a working version as you follow the videos.
The attendance dashboard has an advanced version that you can build, where I will show you more advanced concepts like combining multiple reports to feed a single dashboard, and creating separate visual displays for individual employees / teachers etc.
In addition to learning how to create dashboards with aggregated (overall) data, you will also learn how to create trackers that show granular (detailed / broken down) data, such as tracking daily attendance for students. These concepts can be applied to any industry / niche.
You will also learn how to make your dashboards interactive, so that you or others can set custom criteria which affects your dashboard displays.
If you have any questions about the course, email me (Corey) at corey.spreadsheetclass@gmail.com, I am happy to help!