

Did you know that you can add a trendline to your charts in Google Sheets? Trendlines show the line of best fit for your data, and help you identify patterns and trends in your data, making it easier to draw meaningful insights. In this lesson I am going to show you how to add trendlines to a variety of charts, and I will show you how to select different types of trendlines such as “linear” or “polynomial”.
To add a trendline to a chart in Google Sheets, follow these steps:
- Double-click on your chart to open the chart editor (or click once on the chart, then click the 3 dots in the upper-right corner and then click “Edit chart”)
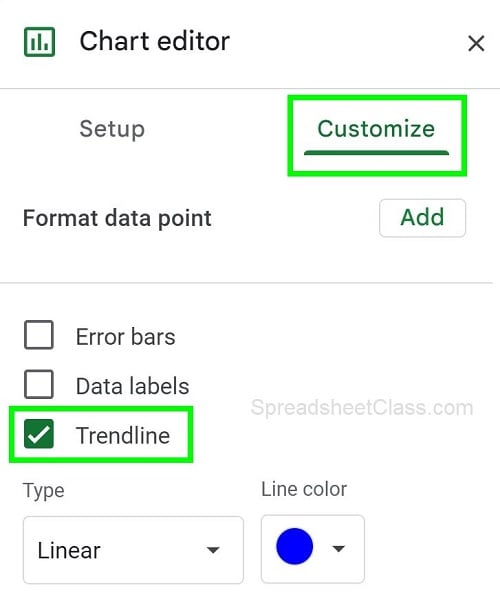
- Click the “Customize” tab
- Click “Series”
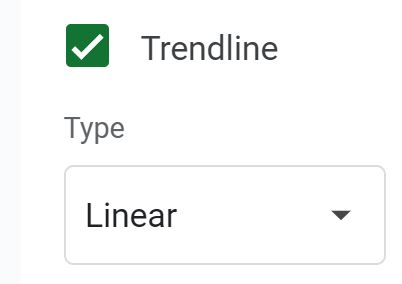
- Click the “Trendline” checkbox
After following the steps above, a trendline will be displayed on your chart, showing the line of best fit. See the examples below to see how to add trendlines to a variety of charts, as well as how to add different trendline types.
Adding a trendline to a scatter plot
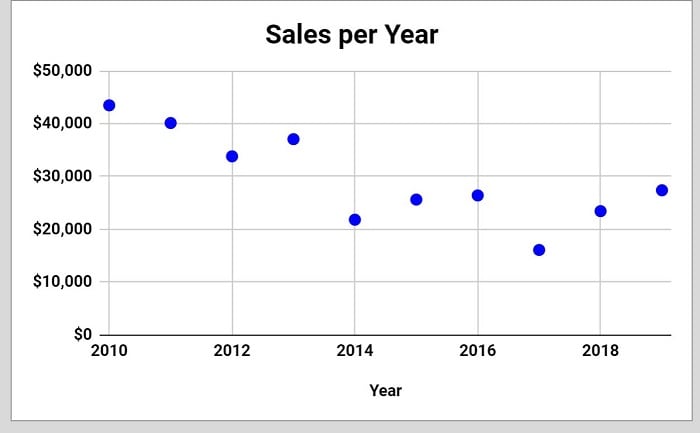
A scatter plot chart is the most common to apply a trendline to because the lines help to see the trends and correlations of the scattered data points.
To add a trendline to a scatter plot, double-click on your scatter chart to open the chart editor, then click “Customize”, then click “Series”, then click the “Trendline” checkbox.
Below you can see the scatter plot before adding a trendline.
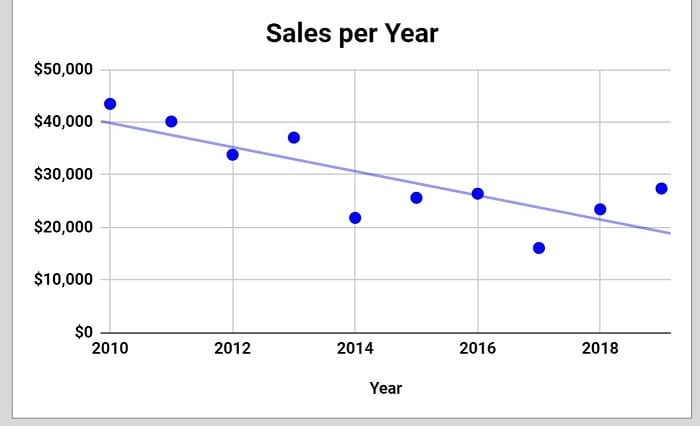
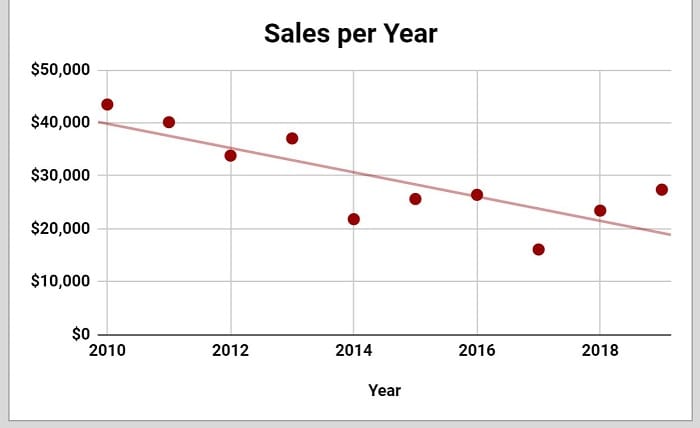
After following the instructions above, the trendline will now display on the scatter plot, as shown in the image below.
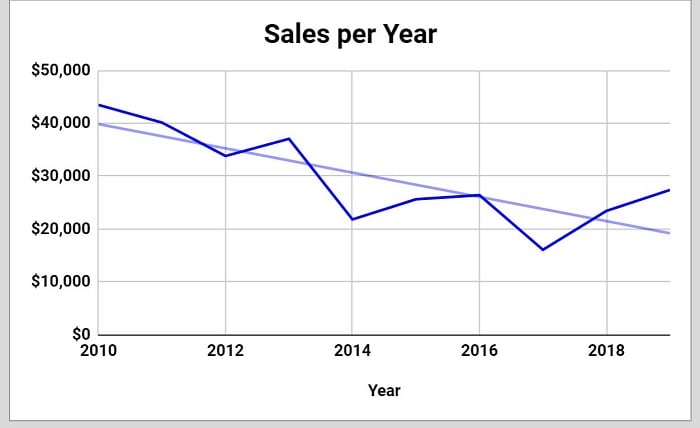
Adding a trendline to a line chart
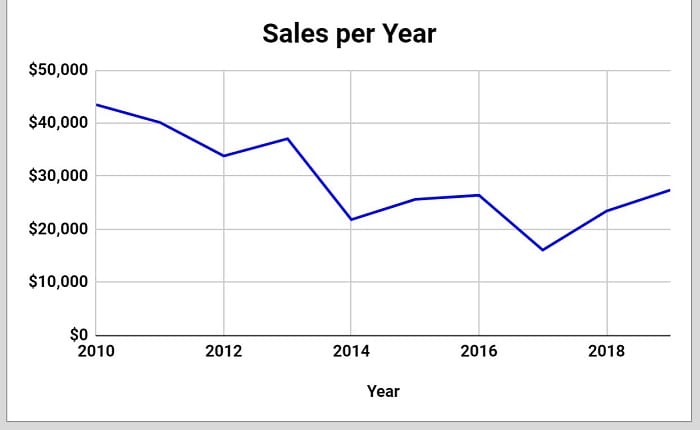
Line charts are excellent for displaying data trends over time. Adding a polynomial trendline can reveal more complex trends.
To add a trendline to a line chart, double-click on your line chart to open the chart editor, then click “Customize”, then click “Series”, then click the “Trendline” checkbox.
Below you can see the line chart before adding a trendline.
After following the instructions above, the trendline will now display on the line chart, as shown in the image below.
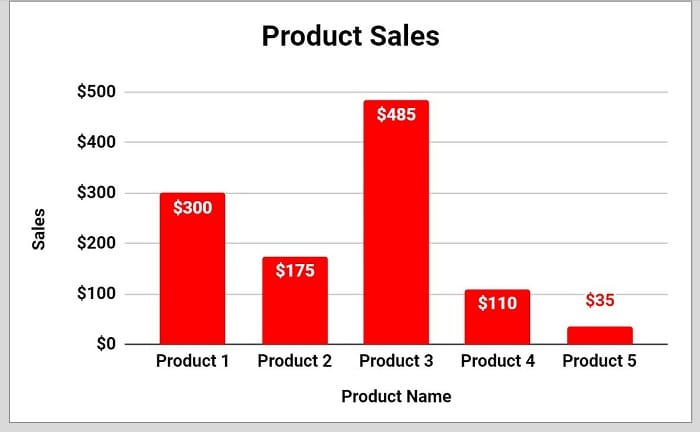
Adding a trendline to a column chart
To add a trendline to a column chart, double-click on your column chart to open the chart editor, then click “Customize”, then click “Series”, then click the “Trendline” checkbox.
Below you can see the column chart before adding a trendline.
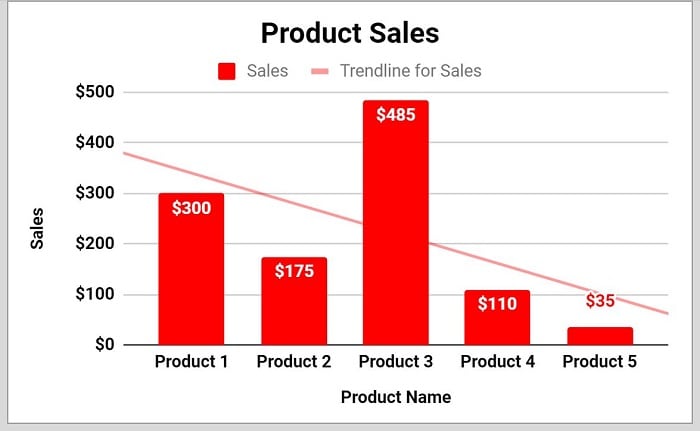
After following the instructions above, the trendline will now display on the column chart, as shown in the image below.
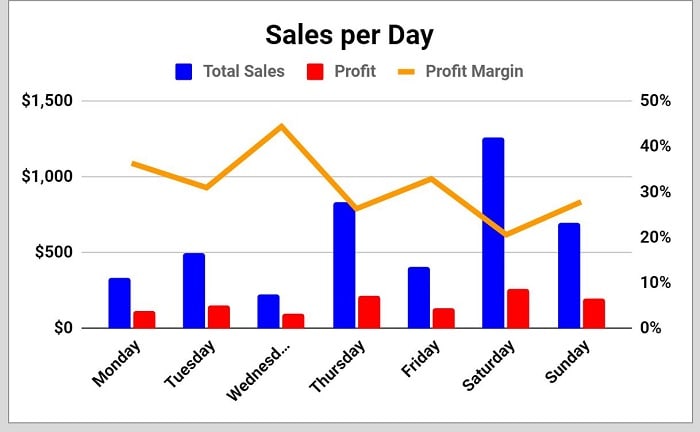
Adding a trendline to a combo chart
To add a trendline to a combo chart, double-click on your combo chart to open the chart editor, then click “Customize”, then click “Series”, then click the “Trendline” checkbox.
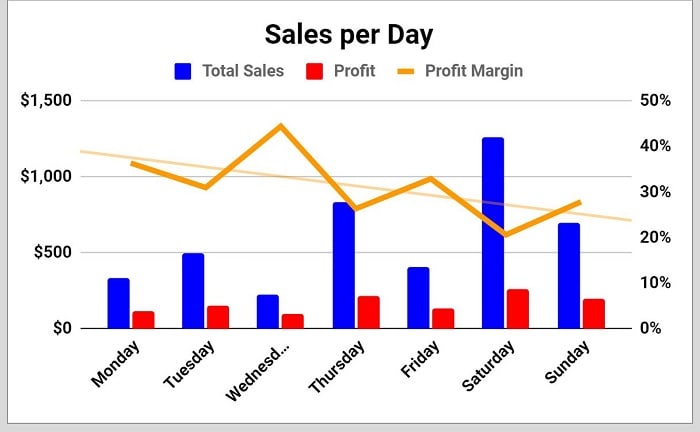
Below you can see the combo chart before adding a trendline.
Adding trendlines to a specific series on a chart
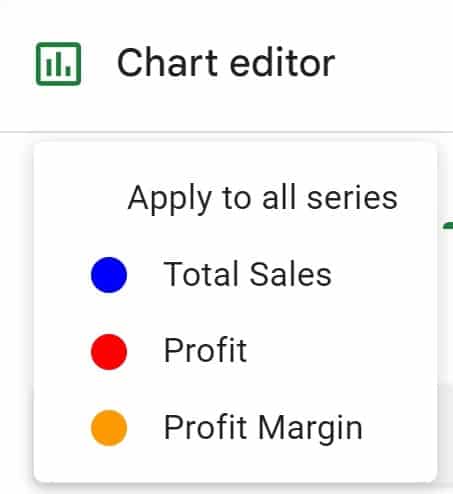
Sometimes you may want to add a trendline to your chart on a specific series, rather than on all series on the chart. You can do this by selecting the appropriate series before enabling the trendline, as demonstrated below.
To add a trendline to a specific series, double-click on your combo chart to open the chart editor, then click “Customize”, then click “Series”. Select the series you want to add a trendline to, and then click the “Trendline” checkbox.
After following the instructions above, the trendline will now display on the combo chart, as shown in the image further below.
Trendline types
You can select different types of trendlines in Google Sheets as well. Experiment with different chart types and trendline options to best convey your data’s story, or simply select the specific trendline type that you want.
Adding a linear trendline to a chart
The default trendline type is “Linear”.
To add a linear trendline to a chart in Google Sheets, follow these steps:
- Double-click on your chart to open the chart editor (or click once on the chart, then click the 3 dots in the upper-right corner and then click “Edit chart”)
- Click “Customize”
- Click “Series”
- Click the “Trendline” checkbox
- Ensure that the “Type” is set to “Linear”
As you can see in the image below, a linear trendline has appeared on the chart.
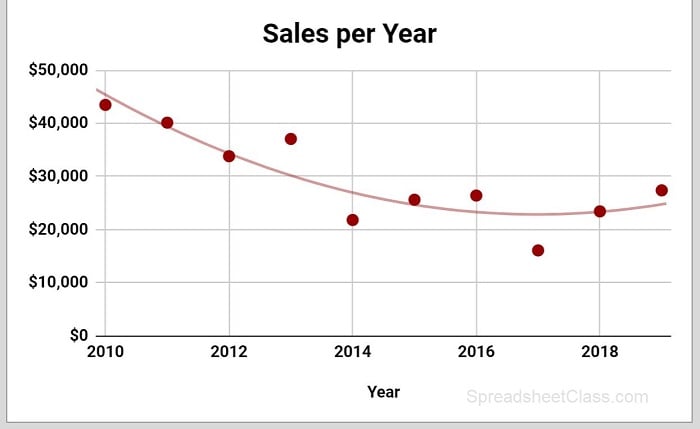
Adding a polynomial trendline to a chart
Now let’s go over how to add a polynomial trendline to a Google Sheets chart.
To add a linear trendline to a chart in Google Sheets, follow these steps:
- Double-click on your chart to open the chart editor (or click once on the chart, then click the 3 dots in the upper-right corner and then click “Edit chart”)
- Click “Customize”
- Click “Series”
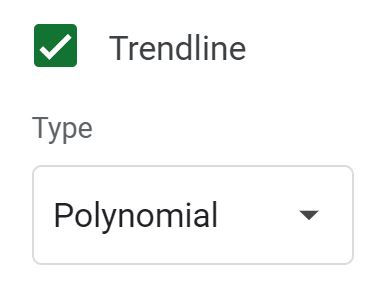
- Click the “Trendline” checkbox
- Ensure that the “Type” is set to “Polynomial”
As you can see in the image below, a polynomial trendline has appeared on the chart.
Now you know how to add trendlines to your charts in Google Sheets!