

Do you have a chart that you have already formatted, and want to copy the formatting from that chart to another chart? Or perhaps you simply want to know how to duplicate charts in your Google spreadsheet. In this lesson I am going to show you how to do exactly that.
The trick is to simply duplicate the chart that you have already formatted, and to change the data range of the new chart. This is something that I used very often when my employer wanted multiple charts to look the same.
To copy chart style / formatting in Google Sheets, follow these steps:
- Click once on the chart, to select the chart that has formatting that you want to copy
- Press Ctrl + C on the keyboard to copy the chart
- Click the tab / cell where you want to place your new chart
- Press Ctrl + V on the keyboard to paste / duplicate the chart into the new location
- In the chart editor, change the “Data range” so that your new chart is connected to the correct data
- Optional: Adjust additional options such as chart title, etc.
After following the steps above you will have a new chart with the same formatting as the original chart, but you will be able to connect it to new data and make additional changes to it without having to format the entire chart all over again.
Click here to get your Google Sheets formula cheat sheet
This process is explained in the detailed examples below. For the examples we will use a stacked column chart that has already been formatted just the way that we want it.
Check out this lesson on creating charts to learn all about creating charts / graphs in Google Sheets, including how to format your data for each different chart.
How to copy chart style / duplicate charts
You can easily copy the style of one chart to another in Google Sheets by simply duplicating the chart that you have already formatted. After duplicating the chart you can change the data range and make any additional modifications that are needed.
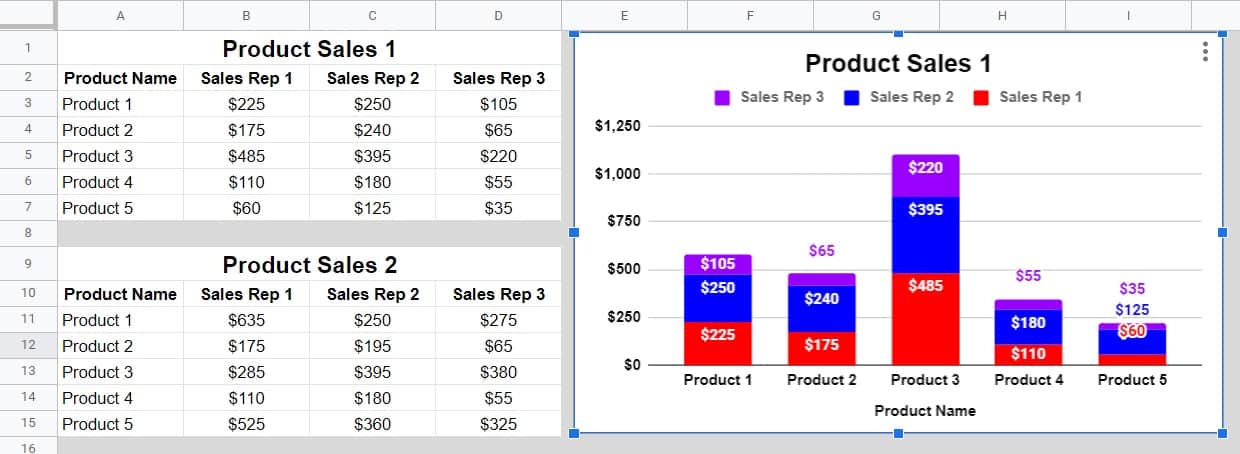
In the example image below, the stacked column chart is connected to the “Product Sales 1” data in rows 1 through 7. We are going to copy the chart style to another chart by duplicating the chart, and connecting the new chart to a different set of data.
We will do this by copying and pasting the chart to duplicate it.
To duplicate a chart in Google Sheets follow these steps:
- Click on the chart that you want to duplicate
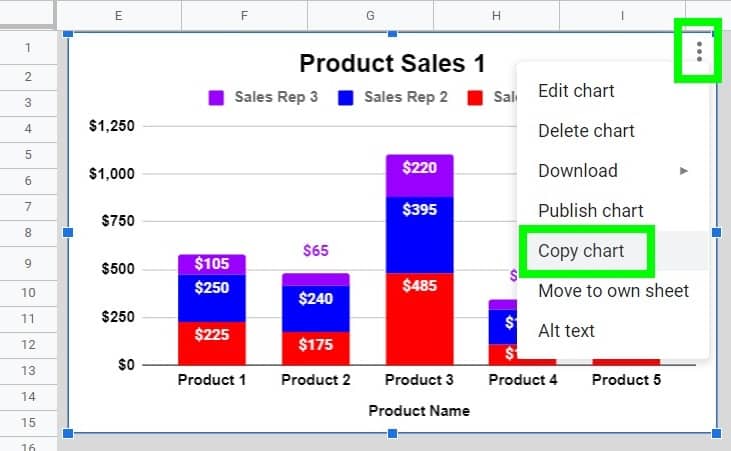
- Press Ctrl + C on the keyboard to copy the chart (Or click the three dots in the upper right corner to open the chart menu, and then click “Copy chart”)
- Press Ctrl + V on the keyboard to paste a duplicate of the original chart. Note that the chart style / formatting will be the same as the original, and by default the duplicate will be connected to the same source data / data range as the original
As mentioned above, if you want, instead of pressing Ctrl + C on the keyboard to copy the chart, you can use the “Copy chart” menu option as shown in the image below.
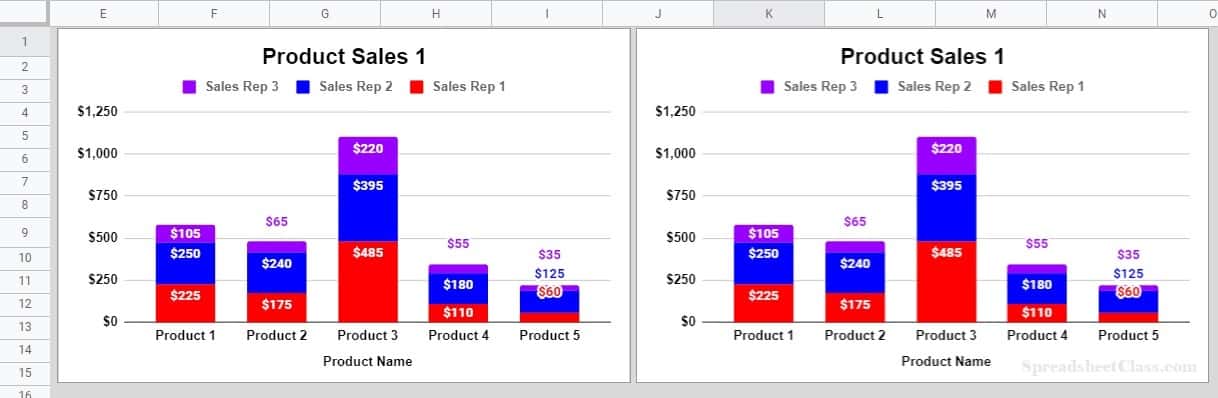
After following the steps above, you will have two copies of the same chart, as shown below. But there are modifications that we need to make to the new chart now.
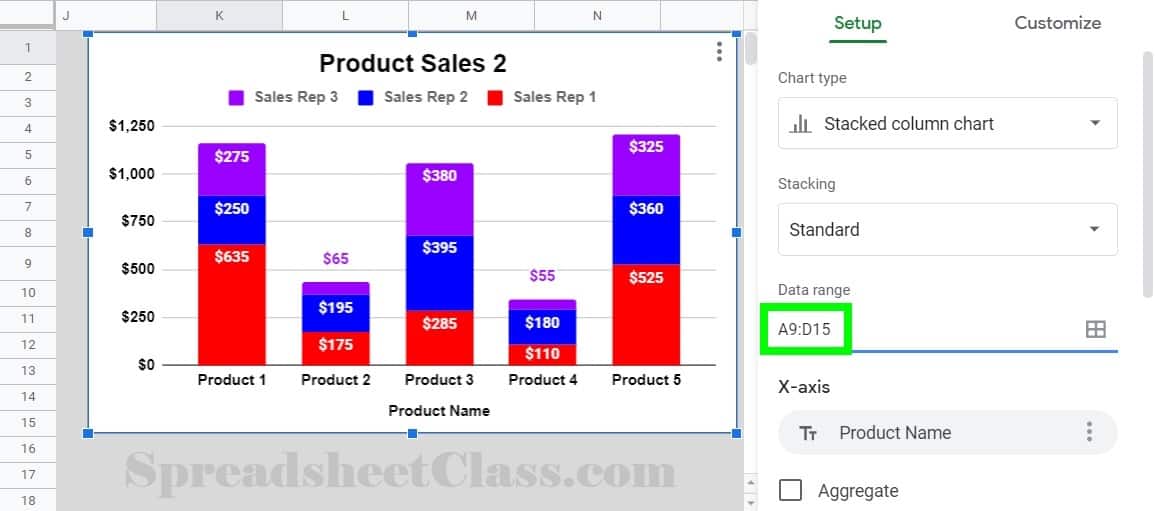
You will probably want your new chart to be connected to a different data set, and so we will need to change the “Data range” of our new chart. In this example, we want the new / duplicated chart to be connected to the “Product Sales 2” data, in rows 9 through 15 (Where the original chart is connected to rows 1 through 7).
To change the data range of a chart in Google Sheets, follow these steps:
- Double click on the chart that you want to edit, to open the chart editor
- Under the “Setup” tab, change the reference in the “Data range” field, to the appropriate range / address (The range of cells that contains the data that you want to connect to your chart)
In this particular example, I am changing the reference A1:D7, to A9:D15.
Now you know how to easily duplicate charts, and how to copy chart formatting from one chart to another!