

Are you looking for an easy way to track the sales for your business? On this page I am going to show you a very easy-to-use sales template that will allow you to keep track of the sales for your products and services.
You can track the revenue that you earn from sales, or if you want you can use the alternate version of the template that allows you to track both sales and expenses (and profit). You will be able to record each different sale / expense, and you can also categorize your sales & expenses to view how much was spent / made in each category.
Note that the cells which are meant to be edited in the template, are the white cells.
Sales template with dashboard
WIth the sales tracker template you can track the sales of your products and services, for each transaction, and you will also be able to view the total revenue for each unique product.
To use the sales template, follow these steps:
- Enter the list of products and services you offer in column D, starting at row 5
- Use the dropdown menus in column A to select the product / service that was sold
- Enter the revenue earned for the transaction in column B
The template will automatically calculate everything else!
If you want to track your expenses without sales data, check out a variety of expense templates that I created.
Or check out the inventory template to track inventory for your business.
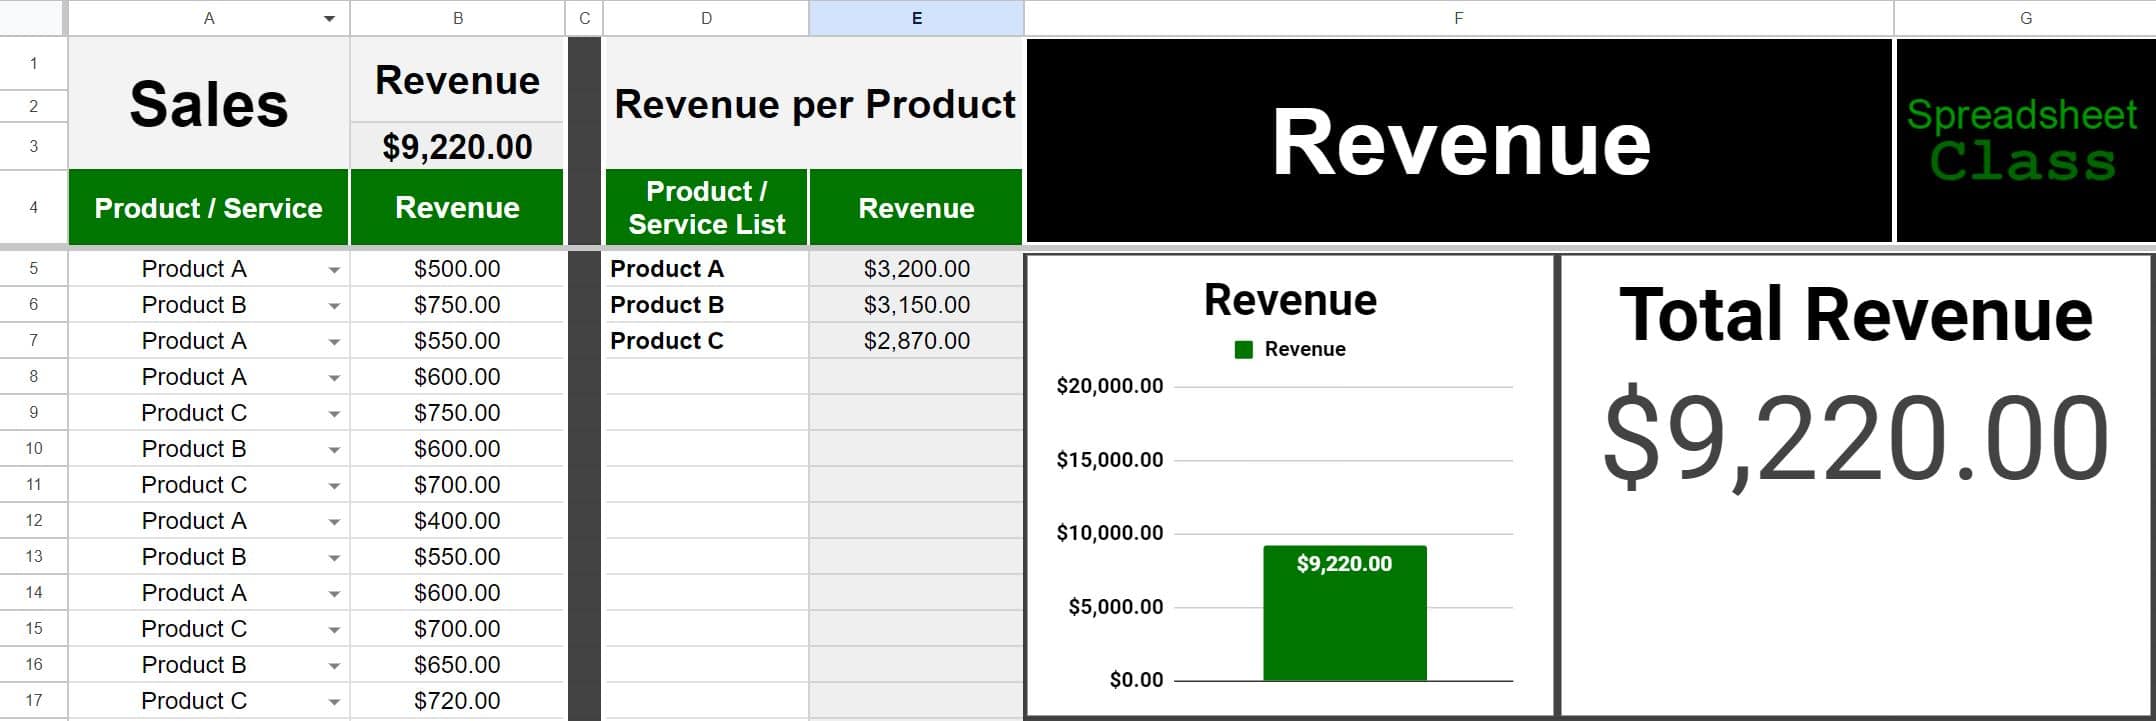
First fill in the product list in column D, and then the dropdown menus will populate and allow you to easily select the products when a sales occurs.
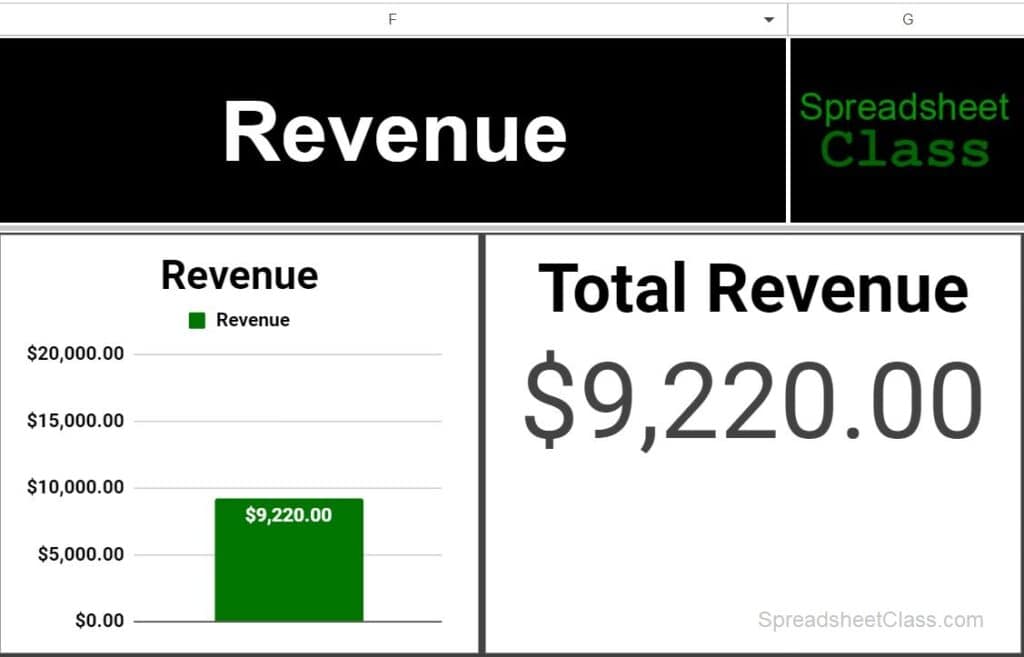
The total revenue is displayed at the top of the sheet, and as well as on the charts in the dashboard section on the right of the sheet. The total revenue earned is shown on a column chart, as well as on a scorecard chart.
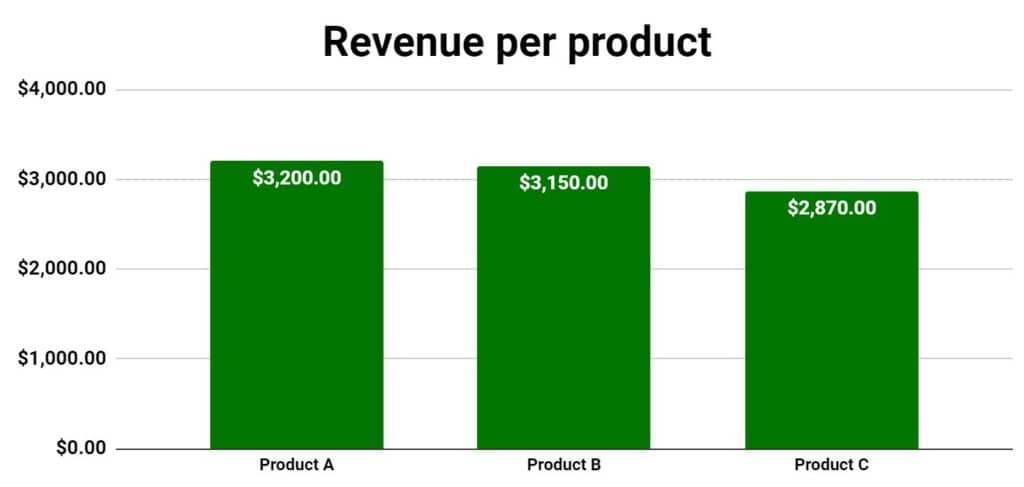
There is a column chart that displays the total revenue earned for each product. Totals per product / service can also be viewed in column E.
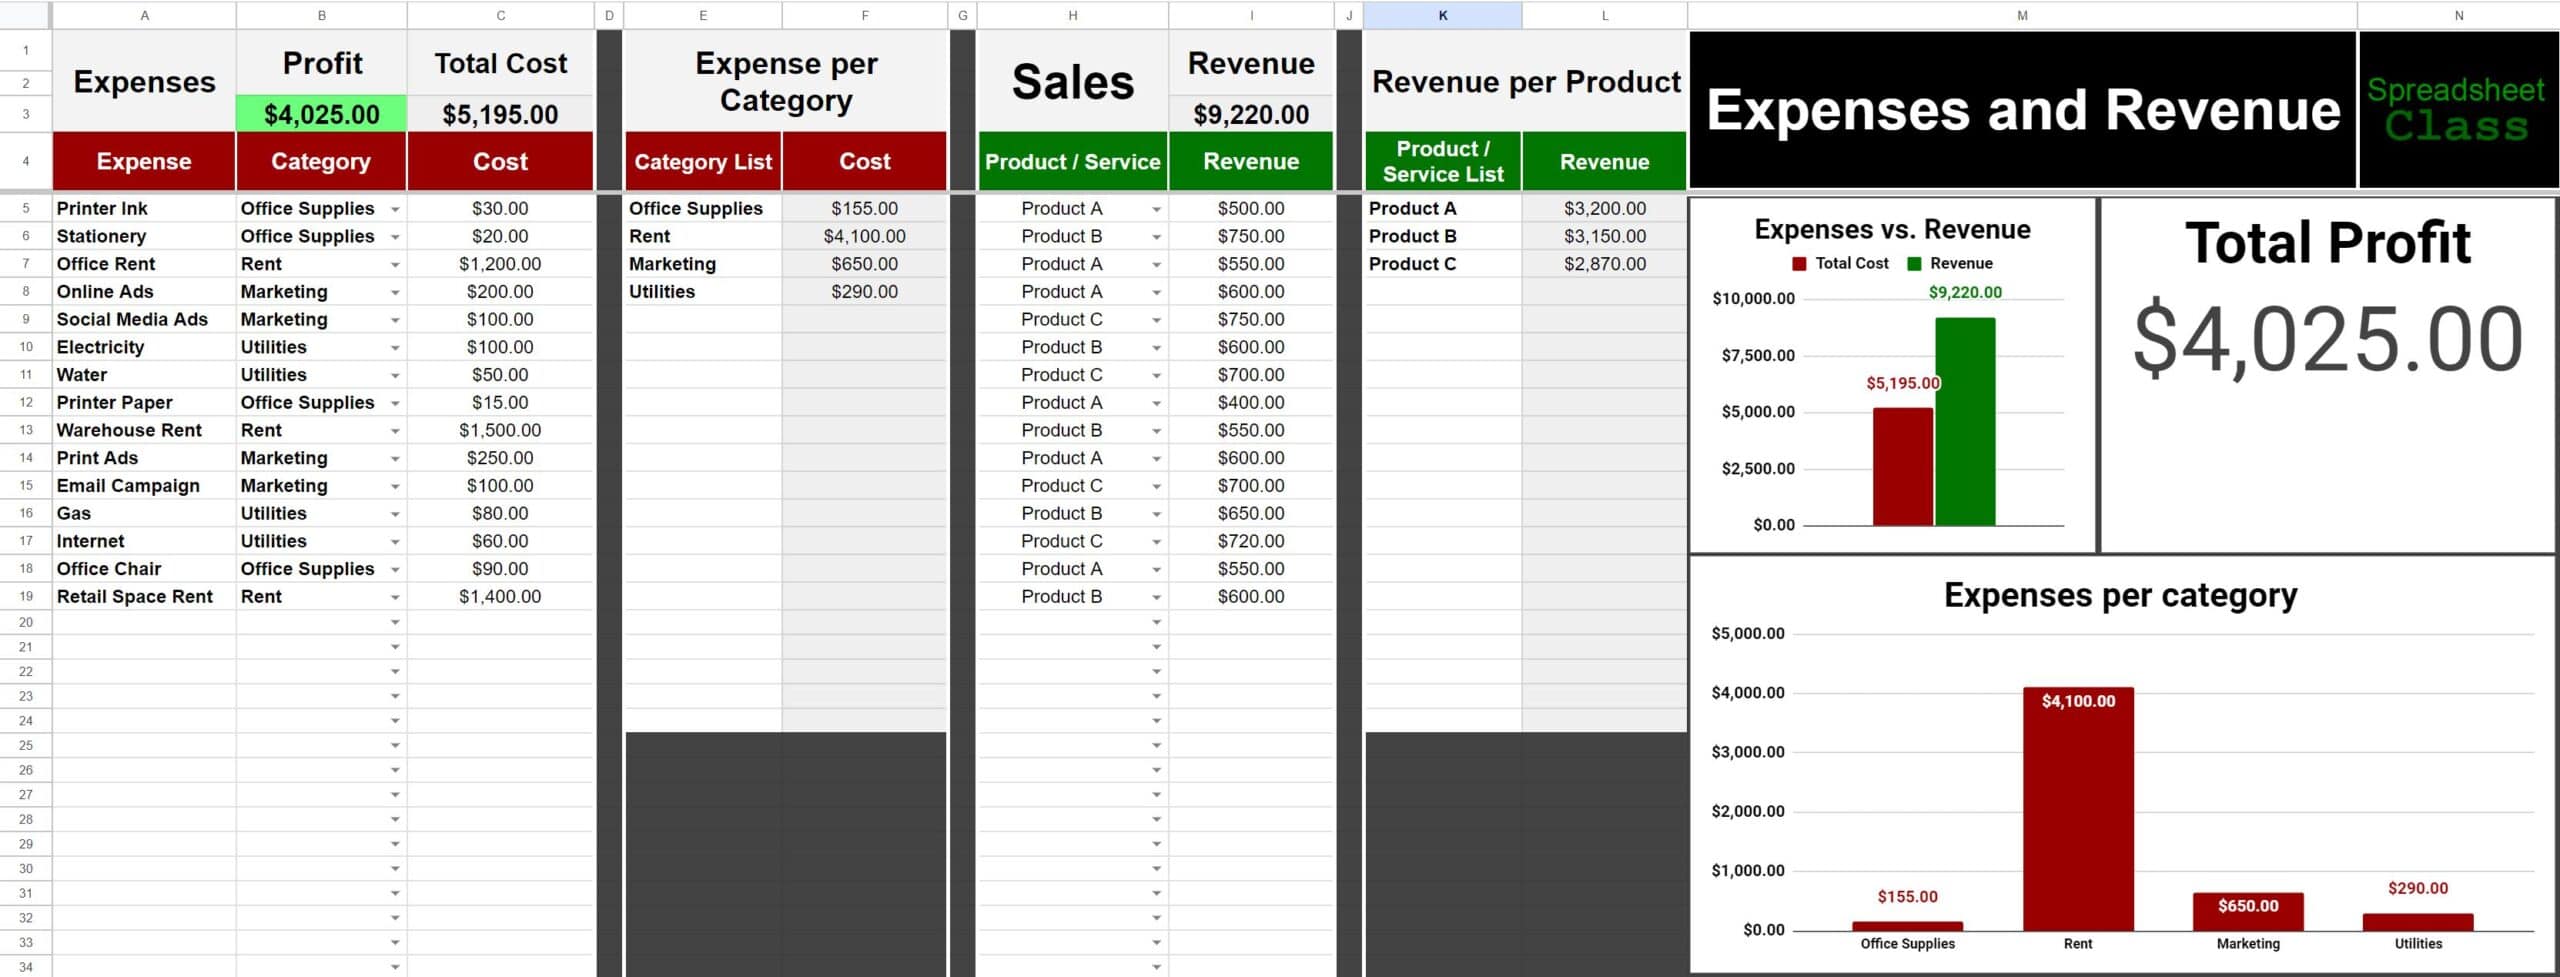
Sales and expenses template with dashboard
With the sales and expenses template you can track the sales of your products and services, as well as the expenses related to your business. You will be able to view the totals for both expenses and revenue, including the totals per category.
The great thing about this version, is that after recording both revenue and expenses you will be able to see profit.
To use the sales and expenses template, follow these steps:
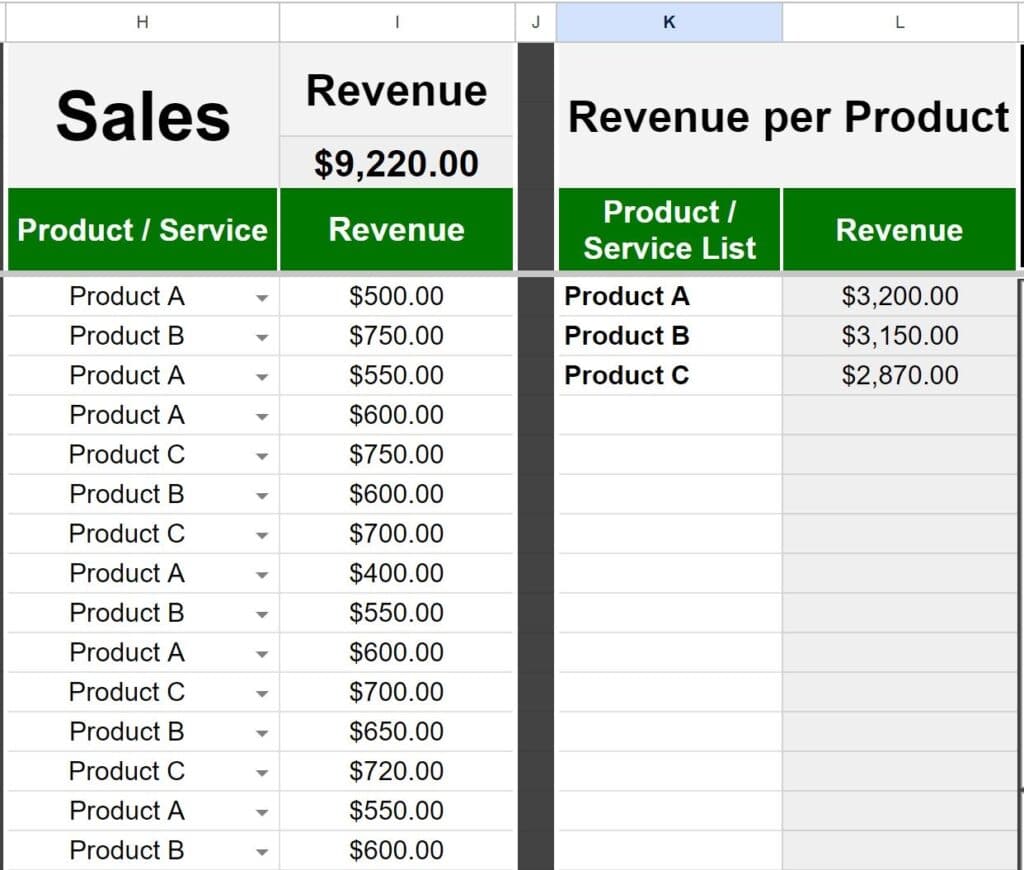
- Enter the list of products and services you offer in column K, starting at row 5
- Use the dropdown menus in column H to select the product / service that was sold
- Enter the revenue earned for the transaction in column I
- Enter the list of expense categories in column E
- Enter the name of the expense in column A
- Enter the cost of the expense in column C
- Use the dropdown menus in column B to select the category for the expense
Then the template will automatically calculate everything else!
Click here to learn how to build a sales dashboard in Google Sheets.
Click here to get your Google Sheets cheat sheet
In columns H through L (green section) you can record your sales data. First fill in the product list in column K, and then the dropdown menus will populate and allow you to easily select the products when a sales occurs.
In columns A through F (red section) you can record your expenses data. First fill in the category list in column E, and then the dropdown menus will populate and allow you to easily select the categories for each expense.
The total revenue, the total amount spent, and the total profit are displayed at the top of the sheet, and as well as on the charts in the dashboard section on the right of the sheet. The total revenue earned vs. amount spent is shown on a column chart, and the total profit is displayed on a scorecard chart.
The profit cell will turn red when profit is negative, and will turn green when profit is positive.
In the dashboard section there is a column chart that displays the total revenue earned for each product. Totals per product / service can also be viewed in column L.
In the dashboard section there is a column chart that displays the total amount spent in each expense category. Totals per category can also be viewed in column F.
See all of the free templates for Google Sheets.