
Are you looking for a Google Sheets template that will allow you to track the performance of your trades, or perhaps the performance of stocks that are on your watchlist?
On this page you will find a variety of stock tracker templates for Google Sheets. Whether you want to track the performance of stocks on your watchlist, or a simple way to track your portfolio, or if you want a detailed analysis of your trading performance… you will find the perfect stock tracker template for you.
You can view live prices, see price trends with sparklines, track profit / loss , and much more! I originally created these trackers for me to use, but wanted to share them with others as well.
Read this article carefully and watch the video below to get the best results from the templates.
Click here to learn all about the Google Sheets formulas cheat sheet
These trackers are not intended for trading purposes. Do not place trades based off of anything that you see in these templates / trackers. Use additional methods and resources to double check the data that you see.
Here is a breakdown of the templates that you will find on this page. You can see the detailed descriptions & instructions below… and in each section you’ll find the link to get a copy of the template!
Simple stock portfolios:
- Stock Analysis Tracker
- Stock Portfolio: Simple Version
Advanced stock portfolios:
- Manual Advanced Stock Portfolio
- Day Trading Stock Portfolio (Broker Report Version)
- Swing Trading Stock Portfolio (Broker Report Version)
Note that you must make your own copy to use the templates. If you are using a desktop computer, when you click the link you should see a prompt to “Use Template”, which will make a copy for you if you are logged into your Google / Gmail account.
How to force the GOOGLEFINANCE function to update
The GOOGLEFINANCE function is used to retrieve stock prices in the stock tracker templates, and although this function will update automatically / periodically… there is a way to force the function to update. However, note that this function will have a slight delay in price updates.
To force the GOOGLEFINANCE functions to update, do this:
- Copy the cell / range of cells that contain the stock symbol(s)
- Delete the contents of the selected cell / range of cells
- Paste the copied selection into the exact same location
(Deleting and then clicking “Undo”, will not have the same effect)
Pulling the prices of crypto is slightly different however, click here to learn how to pull crypto prices into a Google spreadsheet.
Stock Analysis Template (Watchlist + Screener)
Analyze the performance of chosen stocks, then sort and filter by custom criteria
This stock tracker will allow you to keep a watchlist of up to 132 stocks, and will analyze the performance / statistics of each stock in your watchlist, such as the current price, how much the price has risen / fallen for the day, the price trend over time, and more.
You can also use the tracker as a “screener”, to filter / sort your watchlist by specified criteria, so that you can generate lists of stocks that match the criteria you are looking for in your trading strategy.
Note that the cells which can be edited in this template, are colored grey.
Again, do not place trades based off of these trackers. Always double check data with other sources, and perform your own research, before placing trades.
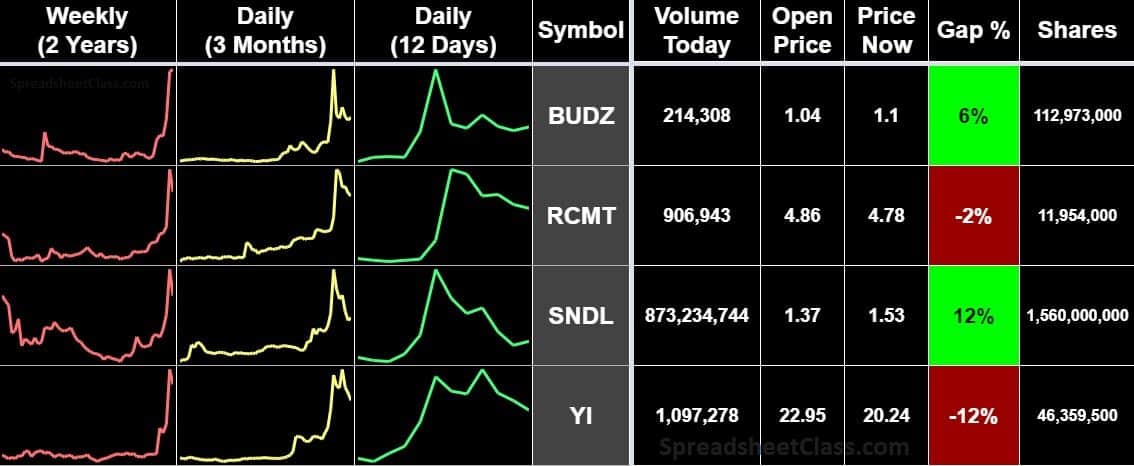
Stock price sparklines
This stock analysis template displays sparklines for each stock in your watchlist, showing the price trend on three different timelines. The red sparkline shows the price trend over 2 years, the yellow sparkline shows the price trend over 3 months, and the green sparkline shows the price trend over 12 days.
Instructions for using the stock analysis template:
- On the “Watchlist” tab, enter stock symbols into the “Symbol” column, to create your watchlist. Data will appear for each valid stock symbol
- On the “Sort / Filter” tab, select custom settings / criteria to screen your watchlist how you would like (See below for details on settings)
- If you want, on the “Favorites” tab, enter the symbol for your favorite stocks to watch, in the “Symbol” column
- If you want, enter new stock symbols on the “List Check” tab to see if the stock is already in your watchlist
“Watchlist” tab
This tab allows you to see a variety of data related to each stock symbol that is entered into the watchlist
Here are the types of data that you can view for each stock in the watchlist:
- Weekly (2 Years): This column shows the weekly price trend over a 2-year period
- Daily (3 Months): This column shows the daily price trend over a 3-month period
- Daily (7 Days): This column shows the daily price trend over a 7-day period
- Volume Today: The volume for the current trading day
- Open Price: The opening price for the current trading day
- Price Now: The current price
- Gap %: The percentage that the price has risen / fallen since open
- *High: Highest price for current trading day
- *Low: Lowest price for current trading day
- *Gap (Pure): The gap percentage considering the low / high price for the day
- Shares: The number of shares outstanding / available to trade
Fields listed with an asterisk (*) are hidden columns by default in the tracker, but can be unhidden if you want to see them.
Each of the columns listed above will also be shown in the “Sort Filter” tab, as well as the “Favorites” tab.
“Sort / Filter” tab (Screener)
This tab shows the same data as the “Watchlist” tab, but allows you to use the template as a “Screener”, so that you can sort and filter your watchlist according to custom criteria.
How to use the settings in the screener:
You must select the check box for each setting to activate it, before entering specific criteria (Criteria will not take effect if boxes are not checked)
If your criteria is too strict / no stocks in the watchlist meet your criteria, then no stocks will appear in this tab.
Volume Filter (Greater Than)
Allows you to filter the watchlist by volume, only showing stocks that have a volume greater than the number set by you
Gap Filter (Greater Than)
Allows you to filter the watchlist by the gap percentage, only showing stocks that have a gap greater than the number set by you
Shares Filter (Less Than)
Allows you to filter the watchlist by shares available, only showing stocks that have a volume less than the number set by you
Sort order
Allows you to choose which order to sort the list in ascending / descending order, according to the “Gap %”
“Favorites” tab
The favorites tab shows the same type of data as the “Watchlist” tab, but it simply allows you to gather a concise list of stocks that you want to keep your eye on, so that you can keep lots of stocks in your watchlist while easily marking the ones that you are very interested in.
If the stock is in your favorites list, when you view the “Watchlist” tab, or the “Sort / Filter” tab, the cell that contains that symbol will show in light purple color, indicating that it is on your favorites list. Your favorites list will also display at the top right of the “Watchlist” and “Sort / Filter” tabs.
Simply enter your favorite stock symbols into the “Symbols” column.
“List Check” tab
This tab allows you to enter stock symbols to see if they are already in your watchlist. Enter symbols into column A, then column B will show if the stock is already in the watchlist, and column D will display a list of stocks from column A that are NOT in your watchlist.
Stock Portfolio: Simple Version
View the performance of open / closed trades
This simple version of the stock portfolio allows you to see the basic performance of trades that you place. There is one tab to track open trades, and another to track closed trades… and a “Totals” tab that will show you totals for both open and closed trades on the same tab.
The only difference between the “Open Trades” tab and the “Closed Trades” tab, are that the “Open Trades” tab calculates totals based off the current stock price, where the “Closed Trades” tab calculates totals based off of the manually entered stock price (The sale price).
Note that the cells that should be edited in this template, are colored white (instead of grey). Don’t let this confuse you with the other templates where the cells that should be edited are grey… and remember that in all of the trackers, the cells that are lighter than the others are the ones that should be edited.
Instructions for using the simple stock portfolio:
- Enter the stock symbol in column A
- Enter the number of shares purchased in column B
- Enter the purchase price for your shares (Or the average purchase price)
- For closed trades, enter the sell price for your shares in column D, in the “Closed Trades” tab
“Open trades” tab (Simple version)
This tab uses the GOOGLEFINANCE function to show you the profit / loss for each trade that you enter. After entering the stock symbol, shares purchased, and the purchase price per share, you will be able to view the following calculated information for each trade, as well as for the entire portfolio:
- Total Purchase Amount (Total money spent on purchasing the shares)
- Value at current price (Total value of shares considering current price)
- Profit (Total dollars of profit / loss)
- % Profit (Percentage of profit / loss)
- Current price per share (The current price of the stock)
The cells in the profit column will turn green when profit is positive, red when the profit is negative / when there is a loss, and yellow if there is zero profit / loss.
*If you want, there is a hidden column (Column D) that allows you to enter the sale price, in the “Open Trades” tab. Although this will not affect the totals in the “Open Trades” tab, it may be helpful to enter the price when you sell it, because this will make it easier to transfer / copy & paste the trade data to the “Closed Trades” tab when you are ready. Of course, the sale price does affect the calculations when entered on the “Closed Trades” tab.
“Closed trades” tab (Simple version)
This tab allows you to view the same data as the “Open Trades” tab, except that the totals are based off of the manually entered sale price, rather than the stock’s current price.
“Totals” tab (Simple version)
In the simple portfolio, the charts that display totals for open trades and closed trades, are shown on the same tab. This “Totals” tab has charts that display your profit in dollars and percentage, again for both open and closed positions. With this you can easily see how your current trades and your past trades performed, all in one place.
Google Sheets Stock Portfolio Trackers: Advanced Versions
View your detailed trading performance
The advanced versions of the stock portfolio will show you much more detail about the performance of your open and closed stock positions, such as profit / loss ratio, profit per day per month, and much more!
The main version of the advanced portfolio that I recommend using first, and for most people, is the “Manual” portfolio. This will allow you to manually enter the data for your trades. There are also two versions that allow you to import a report from your broker, but I recommend that everyone gets a good understanding of the manual version before trying the automatic “Broker Report” versions.
Note that the only cells that should be edited in these templates are the ones that are light grey, or yellow. (For broker report versions, the Import Orders” tab can also be edited. You may notice that the “manual” version of the template has more light grey cells than the other versions, and this is because the data is meant to be entered manually in these locations.
Manual Stock Portfolio
This template allows you to manually enter the data for your open / closed trades, and to see a detailed breakdown of your trading performance.
Note that many of the tabs in the manual version are also found in the broker report versions, so make sure you read the entire “manual version” section to go over what each of the tabs do.
Simply fill in the light grey cells with your trade information / data.
Instructions for using the advanced manual stock portfolio:
- In the “Open Trades” tab, enter the stock symbol (for your open trades), the total shares purchased, and the average purchase price per share (Entering the date is optional)
- In the “Success Rate” tab, enter the stock symbol (for your closed trades), the total shares purchased, the average purchase price per share, the total shares sold, and the average sale price per share. (Entering the date is optional but provides trend data for the other tabs)
- If you want, in the “Filter Success” tab, enter a date that you want to filter by, to show only trades that took place on / after the specified date
“Open Trades” tab
Just like in the simple portfolio, there is a tab to track open trades in, as well as a separate tab to track closed trades in.
In the manual version, simply fill in the light grey cells with your trade information (Date, Symbol, Shares Purchased, Average purchase price per share).
After entering the required data, you will be able to view the following data for each position, as well as overall. Most of these fields apply to both the “Open Trades” tab as well as the “Closed Trades” tab. See further below for examples of these fields:
- Average Price / Share NOW
- Total $ Buy Amount
- Total $ Holdings Value
- $ per Share Gained / Lost
- Win Yes / No
- Profit %
- Profit
- Average Winner $
- Average Winner %
- Average Loser $
- Average Loser %
- Profit / Loss Ratio
- Average Winner / share
- Average Loser / share
- Gained
- Net Profit
- Lost
“Open Totals” tab
In the advanced versions of the stock portfolio, the totals for open positions and closed positions are held on different tabs. The “Open Totals” tab will show you totals for your open positions, including total profit, profit percentage, as well as a chart that shows total money gained vs. total money lost (Gained – Lost = Profit).
The “Open Totals” tab also has a chart that displays the total amount of profit for each stock.
“Success Rate” tab (Closed Trades / Daily Trades)
This tab contains the same columns as the “Open Trades” tab, except that the current stock price is replaced with the sale price, and the “Holdings Value” is therefore replaced with the “Total Sell Amount”. The data from this tab is used by multiple other tabs, to display additional data about your closed trades.
For the manual version, simply fill in the light grey cells with your trade information (Date, Symbol, Shares Purchased, Average purchase price per share, Shares Sold, and Average sell price per share).
When you scroll over to the right in either the “Open Trades” tab, or the “Closed” Trades” tab, you will see detailed data related to your trades.
As you can see the negative values are listed in red, and the positive values are listed in green.
You will see overall totals, as well as statistics for each trade / position… and if you scroll further right you will see even more detailed data related to the overall performance of your closed trades, such as the average winner / average loser size, Profit / Loss ratio, and more!
“Filter Success” tab
After entering the required data into the “Success Rate” tab, you can use the “Filter Success” tab to filter by a selected date, to only display data related to trades that occurred on or after the date that you select. This can help you to easily filter out old trades, and to view your performance as of a certain date.
Simply enter a date into the yellow cell (Make sure that you include the correct year), and then press enter to see filtered data.
“Stock Totals” tab
This tab allows you to see overall totals / performance for each different stock that you have purchased, considering / combining all trades of the same stock. i.e. If you purchased and sold the same stock 3 different times in the same year, you can see what the combined profit / loss is for that stock alone, considering all trades for the same stock.
Note that this tab is connected to the “Filter Success” tab, and so the date on that tab will also control the results of the “Stock Totals” tab.
“Timeline” tab
This tab will allow you to see your profit / loss for each day, as well as each month. Note that this tab is also connected to / affected by the “Filter Success” tab.
You can only view the data for one calendar year at a time in this tab, and so remember to enter the correct year in the yellow cell, in the “Timeline” tab.
“Totals” tab (Closed Totals)
This tab shows the totals for closed trades. As mentioned above, there is another tab that shows totals for open trades.
In this tab you can view your total profit, percentage profit, your win rate, and your profit / loss ratio, and more.
You can also view a stacked column chart that displays the amount you have lost in red, and the amount you have gained in green (Subtracting red from green will match the “Profit” value.
The “Totals” tab also has a column chart that displays the profit / loss per day.
Similarly, there is a chart that shows the profit per month.
Broker report / data import versions
Import your trade data from a CSV report (May not work for all brokers)
The “Broker Report” stock portfolios are designed to allow you to import a CSV report from your broker, so that you can quickly track your trades without having to manually enter them like in the manual version.
There are two different kinds of the broker portfolio template. There is a “day trade” version, as well as a “swing trade” version. Simply put, the day trading version assumes that all trades were opened and closed on the same day, where the swing trade version has additional features that adjust for trades that were opened on one day, and closed on another day. A more detailed description of this is written further below.
Most people will want to use the swing trade version, since most people are not day traders and hold their positions overnight / for multiple days. However, if you do not hold any positions overnight, then the day trading version offers a bit more simplicity (There are simply 7 fewer columns to look at, in the day trading version).
Remember that most of the tabs in these broker report templates are the same as the ones in the manual advanced version, and so most of the spreadsheet tabs that are in the versions described below, were covered in the description of the manual version. The descriptions below simply explain the features that are unique to the broker report versions.
The data required
The type of report that is required for this template, is an “Orders” report. This is not the same as a report that shows your positions. Your positions are what the spreadsheet calculates, based off of the basic “Orders” data. An “orders” report will show each individual transaction, in an individual row.
Your data may look different than mine, especially if you use a broker other than Fidelity. This is why the template is designed to let you choose the correct header row and columns, but there still may be differences that can cause an error, and so look closely at the example pictures, and make sure that your data does not have any rows or special cases that will interfere with the performance of the tracker.
If you need to, remove rows that may cause errors / are not related to normal buy / sell transactions, before importing the data into the tracker. The template is already designed to detect and disregard entries that are not related to buying / selling stock, such as money transfers… but again you may have to remove special cases from your own raw data.
If your data is in a completely different format than you need for using this version of the tracker, then you may want to use the manual version of the advanced portfolio. Your raw data can still help you fill in the manual tracker as well, whether you type it in or copy and paste it.
Also, note the following about the broker report templates:
- These trackers were tested / built with data from Fidelity, as well as one other broker. Note that for these versions, you will have to select your report’s header row as well as the appropriate column names in the “Orders” tab
- The broker report versions are meant to track basic buy / sell transactions, and are not designed to track shorting, or options trading, or any other special type of trading transaction
- These templates assume / require that the report displays shares that were “sold”, as a negative value (Like Fidelity reports)
- The report will only be used to display data for closed trades. Do not include any data for trades that are still open in the report. Open trades must be entered manually on a completely separate tab, in all versions of the stock tracker template.
When calculating a “Position” based on “Orders”, if the same stock is purchased or sold more than once in the same day… the sheet will combine the purchases / sales of each stock into “lots” that display the average price / totals shares considering the entire day.
Instructions for using the broker report portfolios:
- On the “Import Orders” tab, import your “Orders” CSV data, starting at cell A1
- On the “Orders” tab, in cell B3 (Yellow cell), enter the number of the row that your report headers are contained in
- On the “Orders” tab, in row 4, use the drop-down menus to select the appropriate names for the required fields / headers (Date, Symbol, Shares, Share Price, Amount)
- Click the “Success Rate” tab and view the trade performance data (For your closed trades)
- If you want, click the “Filter Success” tab, enter a date that you want to filter your data by, so that only trades which took place on or after the specified date will display / be factored into the calculations
“Import Orders” tab
To use the broker report templates, you will first have to import your CSV data into the Google Sheets template. To do this you can either use the built in Google Sheets import option, or you can simply copy and paste the data into the “Import Orders” tab.
As mentioned above, the data required to use the broker report templates is “Orders” data, which shows each individual order that took place, in a separate row. For example, when logged into your Fidelity portfolio, you can click the “Orders” tab, and there you will find the option to download a CSV containing data related to your trades / orders.
Read above for more detail on data requirements, but remember that your data must display the quantity of shares that were sold, as a negative value, as shown in the picture below.
By default the broker report templates will contain some data as an example, and so you will need to delete this data before importing your own.
“Orders” tab
The next step in using the broker report templates, is to click on the “Orders” tab, and specify the header row of your raw data report, as well as to select the column names that match the needed data types.
Remember that sometimes brokers change their own reports as time passes, and so if they change their header row or column names at some point, you will have to redo this step.
In cell B3, type the number of the row where your headers are in the raw data. In the example below, the headers are in the sixth row, on the “Import Orders tab / in the raw CSV report.
In row 4, use the drop-down menus to select the column name from your raw data that matches the data type specified in row 5. The required data types are: Date, Symbol, Shares (Quantity), Share price, and Amount (Total spent). There is an additional column that you can select from, but it is not required. When you select the column name, the sheet will load the data from that column, into the “Orders” tab.
You will see that on the far right there is a column that checks whether or not the data in each row is related to a buy / sell transaction. This helps to filter out invalid data / rows not related to buying and selling, on other tabs in the sheet.
If the value in the symbol column is more than 5 characters or if it is blank, the sheet will recognize it as not being a normal transaction, and will filter it out. However, if you have special cases that this system does not cover, you may need to manually remove rows containing invalid / irrelevant data from your raw data, before importing it into the sheet.
After completing the steps above, the sheet will show your trading performance on the other tabs, just like the manual version of the advanced portfolios. However, it is good to note which version of the advanced template to use, depending on how you trade. Again, unless you are a day trader, you will want to use the “Swing Trade” version, whether you are swing trading, or investing for a longer period of time.
We already went over the complete instructions for using the broker report portfolios, and the instructions are the same for both versions… so the information below simply explains the differences between the calculations in the day trade version and the swing trade versions. No additional instructions are needed / given below.
Day Trading Stock Portfolio (Broker Report Version)
The day trading template is for trades / data where all of the trades were opened and closed on the same day. This version calculates in a more simple way than the swing trade version, and cannot accurately track trades that were opened one day, and closed on another (i.e. when you purchase stock on one day and sell it on another day).
The “Success Rate” tab is the same in the day trading template, as it is in the manual advanced template… except that in the manual version you type directly in the success rate tab, where in this day trading template the value on the “Success Rate” tab are automatically calculated based on the data that you imported.
However, as described below, the swing trade version is a little bit different when it comes to the “Success Rate” tab (And therefore the “Filter Success” tab as well).
Swing Trading Stock Portfolio (Broker Report Version)
The swing trading template is not just for swing trading… it can also be used for longer term investments as well.
In this template, there are 7 extra columns that the “Success Rate” and “Open Orders” tabs contain, and the sheet calculates positions in a slightly different way.
These additional columns keep track of additional shares that are being held overnight / for multiple days, so that when a stock that was purchased one day and was sold on a later day… the sheet recognizes the shares that were being held from a previous day (as well as the cost basis of these shares), so that the profit can be accurately calculated for the position / trade, when the stock is sold.
Notice in the image below, that on 10/5, shares of SPI were purchased, but not sold on that same day. The sheet shows that there were 10 shares ($69.79 considering purchase cost) still being held at the end of the day.
Then you can see that on 10/6, those same shares of SPI were sold. Even though no shares of SPI were purchased on 10/6, the sheet recognizes that 10 shares / $69.79 were being held from a previous day, and adds this data into the cost basis for 10/6, which allows the sheet to calculate the profit for the position, correctly.
Although this template is designed for trades that are opened and closed on different days, it requires data for closed trades only. If you include data for a position that has not closed yet, the totals will not be accurate. So if you have any open positions in your data, remove the rows from your raw data that pertain to that open position.
Detailed explanation of broker report templates, for advanced users:
(There is no need to worry about this if you simply follow the recommendations for which version to use for your situation. This is simply extra information for people who want to know exactly how things work.)
Note that when using the day trading version, if you do import “Orders” data that contains trades where you bought stock on one day and sold the same stock on another day… the overall totals (but not the averages) will come out the same in both versions of the template (Day vs. Swing), but the data displayed for individual positions / trades, as well as overall averages, will be “thrown off”, for the following reason.
After purchasing stock but not selling it on the same day… the day trading template will assume a sales price of zero dollars, and will think that you took a 100% loss on that day for that trade, when in reality you held the stock overnight. On a later day, when you sell the stock that you previously purchased… the day trading template will think that your percentage gain was infinite on that day, since it will think that your cost basis was zero dollars (again because the day trading template does not consider previous trades in the calculation of each daily position).
The situation described above, when considering calculations for the daily positions in the day trading template, causes a #Div/0 error when the stock is sold, and again shows a 100% loss on the day that the stock was purchased. This will cause the overall averages to be skewed, although the calculation for total profit, balances itself out / will match in both versions.
However, if the same situation / data is entered into the swing trading template, rather than assuming a 100% loss on the date of purchase, it will display a 0% profit for that day, taking into consideration that there was no sale, and that shares are still being held. Then on a later day when the same stock is sold, the swing trading template “looks backwards” and recognizes that shares of the same stock were being held, and adds these into the cost basis so that the profit for that trade on that day (as well as the overall averages), can be accurately calculated.
I hope that you enjoy these Google Sheets stock tracker templates!
See more Google Sheets templates
Click here to get your Google Sheets cheat sheet
Or click here to take the dashboards course