

Click here to go back to the main course page, so that you can see the other dashboards that you can build, as well as to get your dashboard formulas cheat sheet.
Download the raw data
Download these CSV (Spreadsheet) files, so that they will be readily available for you to use / import when you are building the dashboards.
Channel ID Report (Optional)
View a copy of the completed dashboard
A finished dashboard example is linked below, for your reference. Use this template to help you view the formulas and formatting, while building your version as you follow along with the course.
View the completed sales dashboard
After downloading the raw data that is linked above, scroll down and begin the video (or return to YouTube) to start building the online sales dashboard. Timestamps for each chapter are also shown below, so that you can easily find your place if you need to take a break.
Check out my sales tracker templates that you can use to manually track sales, if you want.
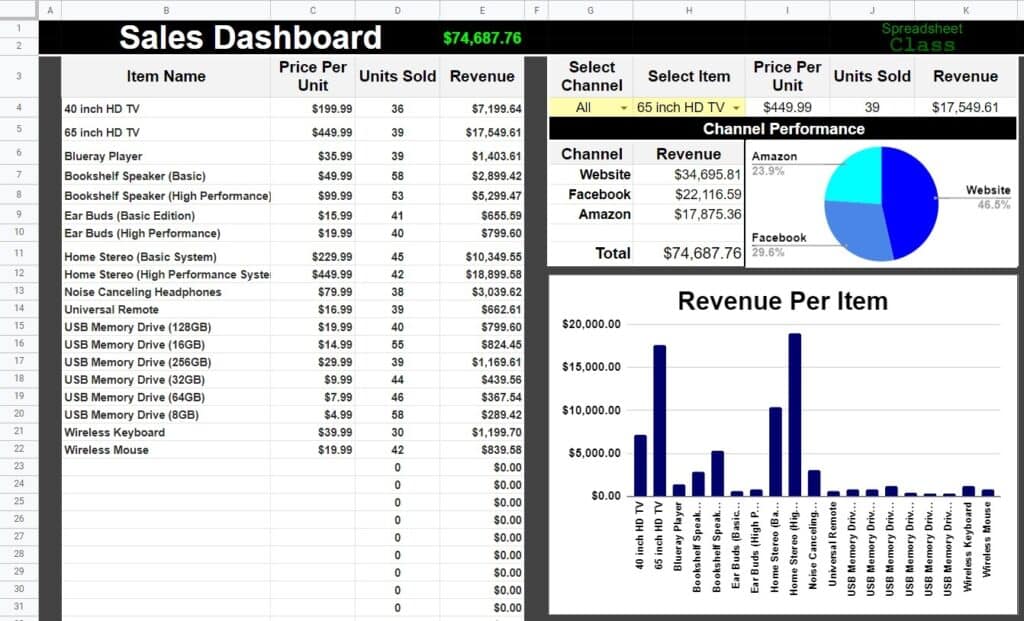
In this lesson I am going to teach you how to build a sales dashboard in Google Sheets (Video is below). You will learn how to analyze the data, and then how to display it with data visualizations. I will also show you how to make the dashboard interactive, so that you can change the view of data by using drop-down menus.
Your completed dashboard will look like the image below, after you complete the final “Revamp” lesson.
How to build the online sales dashboard
Follow along with the video below to build the online sales dashboard!
A note on date formats in varying countries
If you are located in Europe or outside of the U.S., your date format will be different than the United States, and this may affect the creation of some of the dashboards. You can change the date format by clicking File > Settings > General > Locale > United States
Note that Google Sheets has updated the data validation drop down menus. View this lesson to see the updated menu styles.
Want to have a custom spreadsheet built for your business? Click the button below to learn how I can bring your project to life and save your business time.
Timestamps for each chapter / lesson:
0:00:00 1 Sales Dashboard Overview
0:02:27 2 Create and Color Tabs
0:04:01 3 Import Sales Data
0:05:26 4 Build the Channel Filter tab_ FILTER function
0:09:22 5 Add an IF statement to the FILTER function
0:12:28 6 Use INDEX and SPLIT to extract the date
0:14:47 7 Use ARRAYFORMULA to extend the formula downwards
0:16:33 8 Apply the IFERROR function
0:17:49 9 Build the daily sales timeline
0:21:16 10 Add NOTE about ending Calculating the daily revenue_ SUMIF
0:26:16 11 Format the dashboard tab
0:31:43 12 Generate a list of prices and items
0:34:40 13 Calculate the total units sold_ SUMIF
0:37:41 14 Calculate the total revenue per item
0:40:17 15 Create the channel selection drop down menu
0:43:27 16 Create the item selection drop down menu
0:44:10 17 Use INDEX MATCH to lookup item data (Like VLOOKUP)
0:49:45 18 Optional_ Bonus INDEX Match Lesson
0:54:23 19 Optional_ Bonus lesson 1 (Copy and paste values only)
0:57:02 20 Calculate the total revenue per channel
1:01:12 21 Create a pie chart for channel revenue
1:04:16 22 Create a column chart for item revenue
1:10:04 23 Create a line chart for daily revenue
1:15:11 24 Add a logo
1:16:15 25 Protecting and sharing your dashboard
1:21:34 26 Sales Dashboard Revamp