

Have you ever created a chart in Google Sheets, and wanted to add more data to it / add another series to the chart? There are a couple very easy ways to do this, so in this lesson I am going to show you how to add a series to a chart in Google Sheets, and I will show you multiple ways to do it depending on your preference.
To add a series to a chart in Google Sheets, follow these steps:
- Double-click on the chart to open the chart editor (Another way you can open the chart editor, is to click once on the chart, then click the 3 dots in the upper-right corner, and then click “Edit chart”)
- On the “Setup” tab, click “Add series”
- If the series that you want to add is already in the dropdown menu, click on it to add it to the chart
- If the series that you want to add is not displaying in the dropdown, click the grid icon that says “Select a data range”
- Select the range of cells that contains the data you want to add as a series on the chart (or you can also type the range in the “Select a data range” menu that pops up)
- Click “Okay” and your series will now be added to your chart
Below I will show you detailed examples of using multiple methods to add a series to a chart in Google Sheets.
Click here to learn how to create & customize charts in Google Sheets.
Check out this lesson if you want to learn how to change the series order on a chart.
Adding a series to a chart by selecting the new series / data range
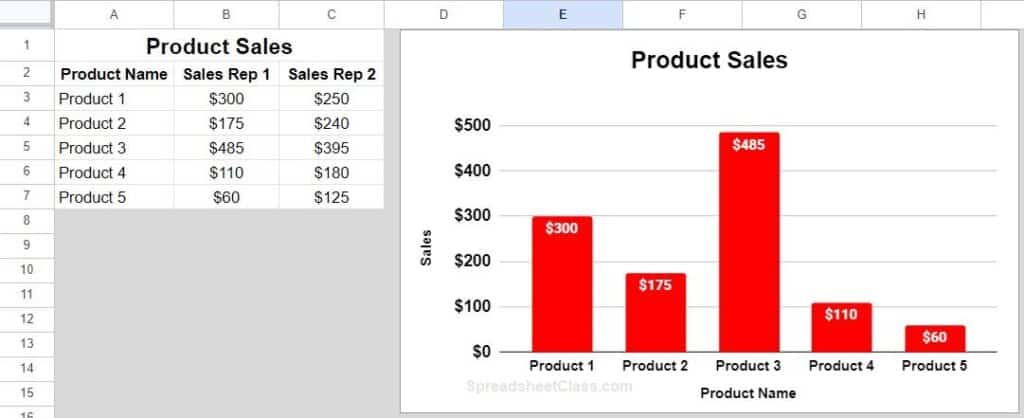
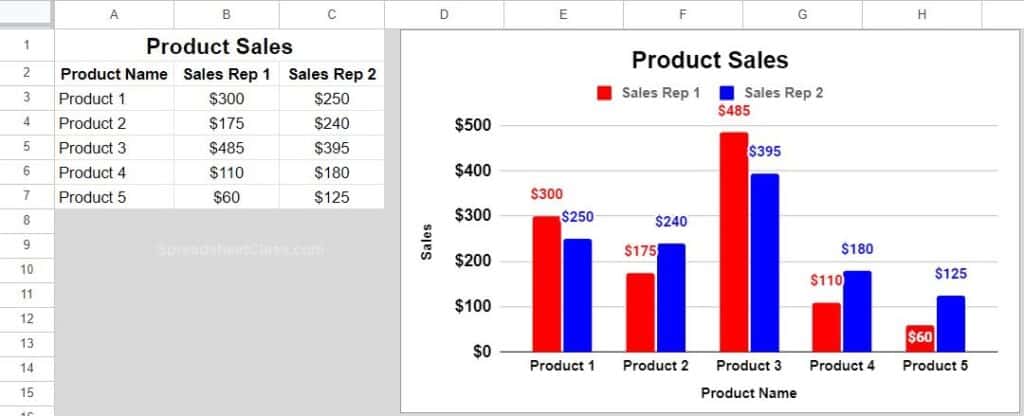
In this example, we have a column chart with one series. As you can see in the image below, although there is one series on the chart, there are two series of data available (“Sales rep 1” and “Sales rep2”). The chart is showing the data for the “Sales rep 1” series and what we want to do is add “Sales rep 2” to the chart.
This chart displays how much money sales rep 1 made for each of a variety of products.
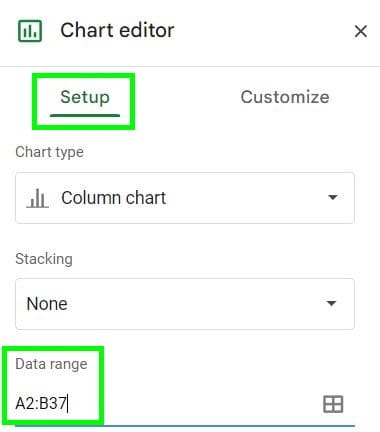
Note that in this example the data range in the chart editor is A2:B37, which contains the product name (x-axis) and the first sales rep (first series). Since the data range for the chart does not contain column C (sales rep 2 / the second series), when we click the “Add series” button… “Sales rep 2” will not be available in the dropdown menu, and so we will have to select a new data range to add the new series to the chart.
To add the series to the chart, follow the steps below.
Double-click on the chart to open the chart editor.
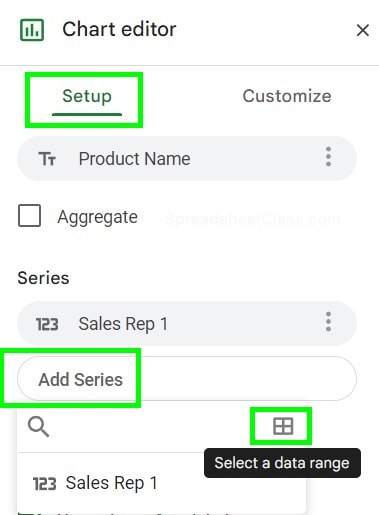
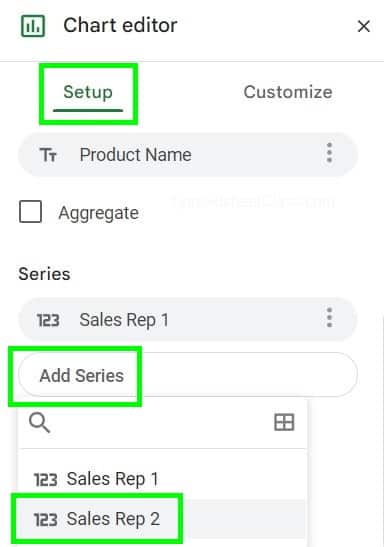
On the “Setup” tab, scroll down to the section that says “Series”
Click “Add series”
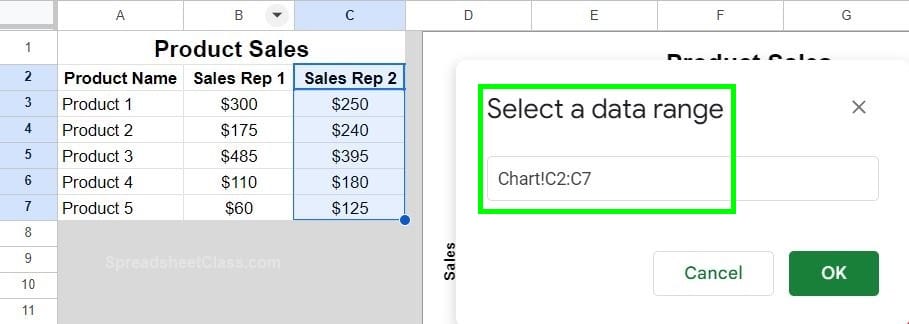
In this example the data range for the chart does not initially capture column C / the data range that contains the data for sales rep 2, and so we will select a new data range to add to the chart.
Click the grid icon that says “Select a data range” when you hover your cursor over the icon.
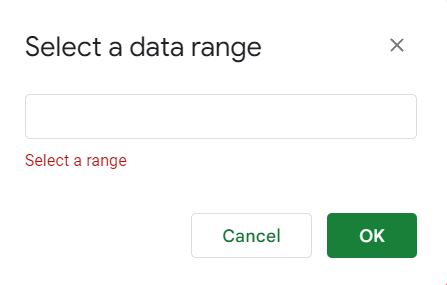
A menu will pop up that says “Select a data range” Either type the range C2:C7, or select the range C2:C7 which will automatically fill in the blank field with the range.
Then click “Okay”
After following the steps above, the new series (sales rep 2) will be added to the chart, as you can see in the image below. Now the chart displays both sales rep 1, and sales rep 2.
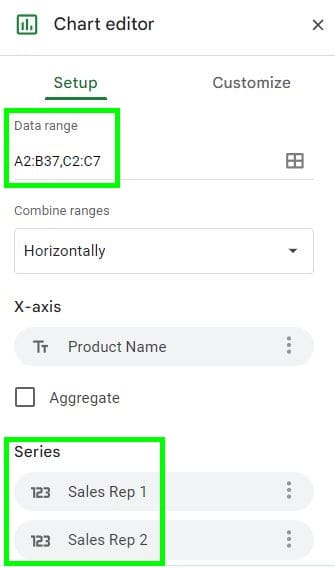
Note that when we used this method to add a series to the chart, Google Sheets added a new range to the “Data range” field in the chart editor under the “Setup” tab. In this case the original range was A2:B37, and after selecting the new range Google Sheets added a comma and then the range C2:C7, so that now the “Data range” field says A2:B37,C2:C7.
Also notice that it’s okay that the first range extends to row 37, where the next range extends to row 7. There is no data below row 7 and so any additional rows included in the range are not being displayed on the chart because they don’t contain data. The important thing is that both of the ranges begin on the header row.
Click here to get your free Google Sheets cheat sheet
Add a series to a chart by editing the data range first
Now let’s do the same thing from the last example (add “Sales rep 2” series to the chart) but we will use a slightly different method. This time we are going to edit the data range before clicking “Add series” so that the series we want to add will be available directly in the dropdown menu after clicking “Add series”.
Double-click the chart to open the chart editor.
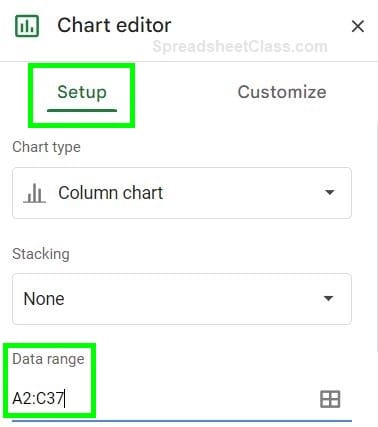
On the “Setup” tab, edit the “Data range” field, so that the range includes all data / every series that you want on the chart. In this case will will change the data range to A2:C37 (then press “Enter” on the keyboard)
Now that the data range includes column C, “Sales rep 2” will now be available from the “Add series” dropdown
Click “Add series”
Select “Sales rep 2” / the series that you want to add.
After following the steps above, the new series (Sales rep 2) will now be added to the chart, as shown in the example image from the previous example. The chart will include both “Sales rep 1” as well as “Sales rep 2”.
So to add a new series to a chart on Google Sheets, the “Data range” must include the columns that contain the data that you want to add to the chart.
When you click “Add series” if the series you want to add is already displayed in the dropdown, simply click on it to add the new series.
If the series does not display in the “Add series” dropdown menu, this means that the data range for that series must be added. You can do this by clicking the grid icon and then selecting the new range, or you can edit the “Data range” field in the chart editor before clicking the “Add series” dropdown.
Now you know how to add a new series to a chart in Google Sheets!
This content was originally created by Corey Bustos / SpreadsheetClass.com