

In this lesson I am going to teach you how to chart data that is on a different tab than the chart, and I will also show you how to chart data that is on multiple tabs. There are multiple ways to do these things, and I will teach you each method so that you can find the one that you prefer most.
To chart data from another sheet in Google Sheets follow these steps:
- Insert a chart on the tab that you want the chart to be on (Click “Insert” on the top toolbar, and then click “Chart”)
- Select the chart type (Column, Line, etc.)
- In the “Data range” field, enter the range / address for the data that you want to connect to the chart, including the tab name, like this (If the data is held on the tab named “Data”): Data!A1:D7
- Now your chart is connected to data that is on a different sheet / tab than the chart is, i.e. the chart and the data are on different tabs
To chart data from multiple sheets in Google Sheets follow these steps:
- Make sure that the data sets which are held on separate tabs, are in the same format. For example if your data on the first tab is listed on columns (instead or horizontally in rows), then the data on the second tab should be listed in columns as well
- Insert a chart on the tab that you want the chart to be on (Click “Insert” on the top toolbar, and then click “Chart”)
- Select the chart type (Column, Line, etc.)
- In the “Data range” field, enter the range / address for the first tab that contains data that you want to connect to the chart, including the tab name, like this (If the data is held on the tab named “Tab1”): Tab1!A1:D7
- Type a comma after entering the first range
- Enter the range / address of the data that is on the second tab / another tab than the first data set. With both ranges entered (separated by a comma), the data range will look like this: Tab1!A1:D7,Tab2!A1:D7
- Now your chart is connected to multiple data sets, where each data set is on its own tab, and the chart is on a completely different tab than the data
Alternative methods, as well as illustrated examples are shown below.
Click here if you want to learn how to create / customize charts in general.
Click here to get your Google Sheets cheat sheet
Chart data from another sheet in Google Sheets
In this first example I will show you how to chart data that is on another sheet, i.e. I will show you how to put a chart on one tab, where the chart is connected to / refers to data on another tab.
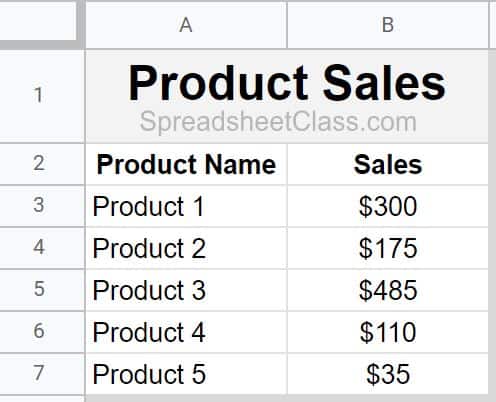
Directly below you can see the data that we will connect to our chart. The data is held on a tab named “Data”. See further below for 2 different methods of connecting your data to a chart on a different sheet.
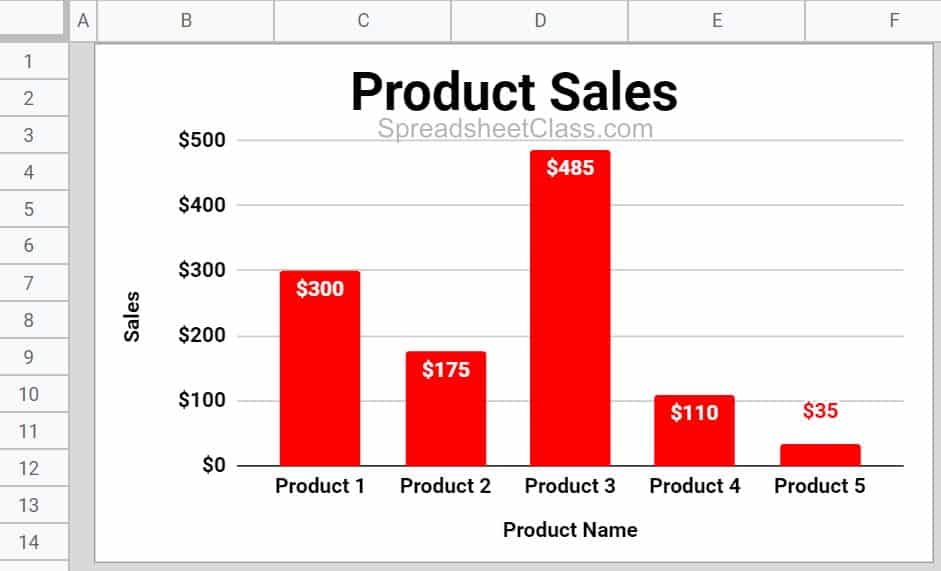
Below is the column chart that is connected to / refers to the data on the “Data” tab. This chart is on a completely different tab than the data itself.
To insert a chart, and chart data from another sheet, follow these steps:
- Insert a chart on the the tab where you want your chart to be (Click “Insert” on the top toolbar, and then click “Chart”)
- In the chart editor, under the “Setup” tab, in the “Data range” field, enter the range of the data that you want your chart to refer to, including the tab name, like this: Data!A1:B41 (Double click on the chart to open the editor, if the chart editor is not already open)
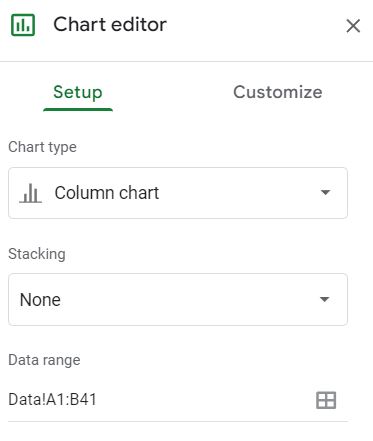
In the image above you can see what the data range looks like when it is filled in with a range from another tab. Be sure to include the tab name before typing the range of cells, and put an exclamation point after the tab name (as shown in the image).
2 Methods for connecting a chart to data
Above I showed you one of the two ways to connect data to a chart. In the method discussed in the previous example, we inserted a chart first, and then typed the data range (If you want you can click on the grid icon in the “Data range” field to select the range).
But if you want, you can also select the range of cells that contains the data to be charted (before inserting the chart), and then insert a chart while the cells are selected. This will automatically fill in the data range when you insert the chart.
Chart data from multiple sheets in Google Sheets
Now that you know how to chart data from another (single) sheet, let’s go over how to chart data from multiple sheets in Google Sheets, where you have a chart on one tab, data on a second tab, and more data on a third tab.
The process is the same as in the previous example, except that when you are charting from multiple sheets, you’ll need to enter multiple ranges in the “Data range” field (separated by commas).
Data set 1 / Tab 1
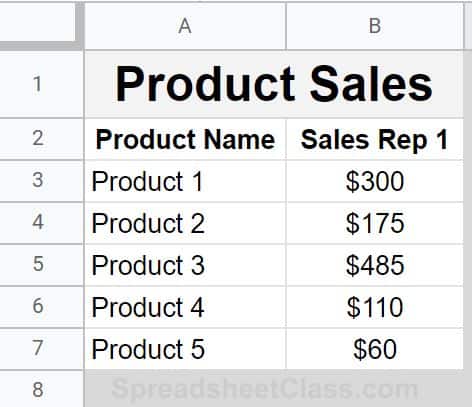
So in this example, we have two sets of data. The first set of data is on a tab named “Data 1”.
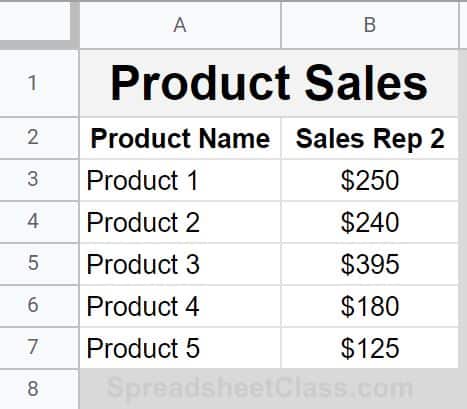
The second set of data is on a tab named “Data 2”.
See further below for instructions on how to connect the data to the chart.
This content was originally created by Corey Bustos / SpreadsheetClass.com
Data set 2 / Tab 2
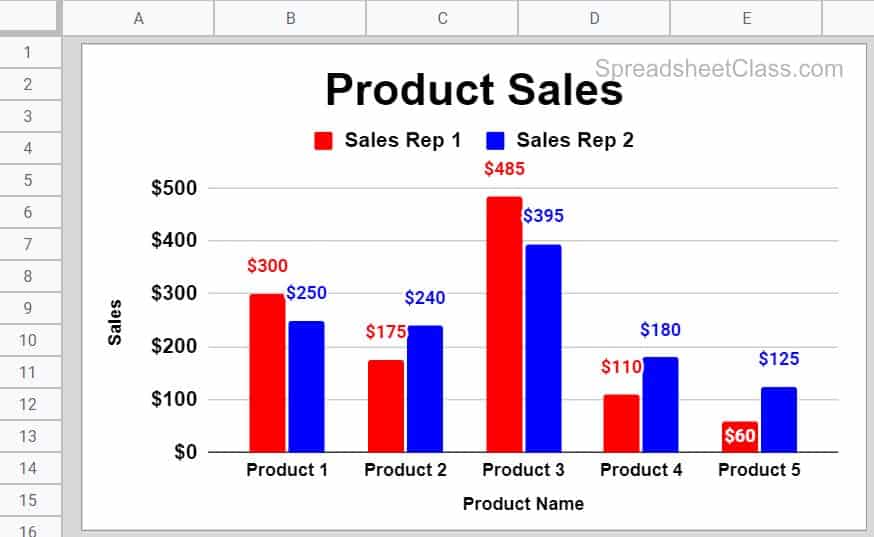
Below is the column chart that we will connect to our data that is held on multiple sheets. As you can see, since there are multiple sets of data, the chart has multiple “series”. Click here to learn more about charting multiple series in Google Sheets.
To chart multiple series in Google Sheets, follow these steps:
- Insert a chart on the tab where you want your chart to be
- In the chart editor, under the “Setup” tab, in the “Data range” field, type the address of the first data set (from the first tab) including the tab name and the range
- Type a comma, and then type the address of the second data set (from the second tab) including the tab name and the range
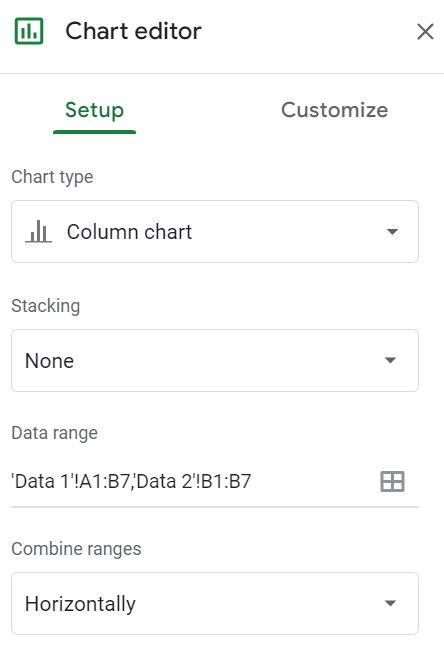
In the image above you can see both of the addresses / ranges (for the data held on separate tabs) type in the data range field.
Combining range (horizontally vs. vertically)
You should notice that when you have entered multiple ranges into the char editor’s “Data range” field, you will have the option to select “Horizontally” or “Vertically” from the “Combine ranges” menu.
If your data is listed in columns, then choose to combine the ranges horizontally. If your data is listed in rows, then choose to combine the range vertically.
How to add a series to a chart in Google Sheets
Sometimes you may find that you have entered the correct data range for your chart, but not all of the data is appearing on the chart. To fix this you can add a series to a chart manually.
In the example below, the data range that is entered contains data for “Sales Rep 1” as well as “Sales Rep 2”, but for some reason the data for the second sales rep does not appear on the chart, and so we will add the series “Sales Rep 2” manually. See further below for instructions.
To add a series to a chart in Google Sheets, follow these steps:
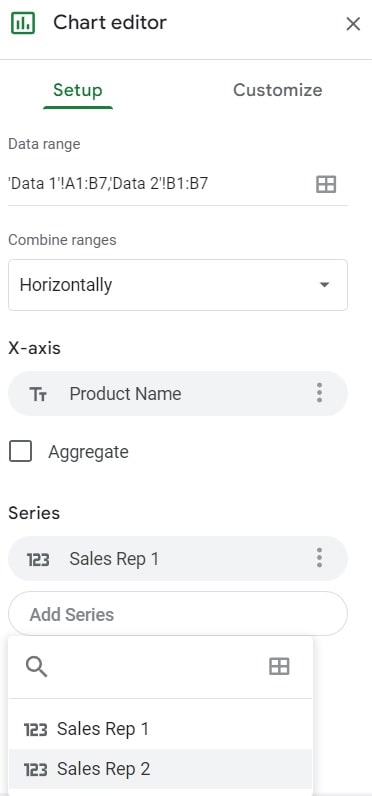
- In the chart editor, under the “Setup” tab, click “Add series”.
- The menu will display the available data / series to add (They are named according to the header of your data)
- Click the series that you want to add
In this example we are going to click “Sales Rep 2”, and then the data for the second sales rep will appear on the chart.
Alternate method for charting data from multiple sheets: Bring the data together into a single sheet
Another way that you can chart data from multiple sheets, is to create a tab where you will bring all of the data together by using the ARRAYFORMULA function to refer to data on different sheets… and to align that data together on a single tab.
For example if you have data on “Tab1”, and more data on “Tab2”, you can create a new tab, and then pull the data from tabs 1 and 2 into the new tab by referring to it with the ARRAYFORMULA function, like this:
=ARRAYFORMULA(Tab1!A1:A)
=ARRAYFORMULA(Tab2!A1:A)
If you place the first formula in column A, and the second formula in column B, then you would be pulling data from different sheets into a single place that you can then refer to with your chart.